The blog of dlaa.me

Posts tagged "WPF"

The platform giveth power, don't taketh it away [Tip: Do not assign DependencyProperty values in a constructor; it prevents users from overriding them]

Tip

Do not assign DependencyProperty values in a constructor; it prevents users from overriding them

Explanation

Initializing variables in an object's constructor is considered a Good Thing. Traditionally, initialization is done with a simple assignment that sets the variable to its initial value: MyProperty = 10;. However, doing that with a Silverlight/WPF DependencyProperty uses the CLR wrapper (more background here and here) and results in a call to SetValue that sets the local value of that property. The precedence order for DependencyProperty values is such that the local value overrides almost any other value the application may have provided with a Style (normal or implicit) Setter or Trigger. But if a property can't be styled, then much of the goodness of being a DependencyProperty goes out the window... Fortunately, there are two good alternatives; the most direct is to pass the default value in the call to Register. Setting the default value that way is nice because it's easy, it's obvious, and it "just works". And since DependencyProperty default values have the lowest precedence of anything, you don't need to worry about overriding any customizations users may have made. Next time: The other option.

Good Example

public static readonly DependencyProperty MyPropertyProperty = DependencyProperty.Register(
    "MyProperty", typeof(int), typeof(MyControl), new PropertyMetadata(123, OnMyPropertyChanged));

More information

Freedom isn't free [Tip: When creating a DependencyProperty, follow the handy convention of "wrapper+register+static+virtual"]

Tip

When creating a DependencyProperty, follow the handy convention of "wrapper+register+static+virtual"

Explanation

The fundamental steps for defining a Silverlight/WPF DependencyProperty are fairly rigid and not open to a great deal of flexibility (as I discuss in this earlier tip about the CLR wrapper). However, there's a bit more freedom once you add a default value or a PropertyChangedCallback delegate to the mix - but don't let it go to your head! :) For convenience and flexibility, I recommend the pattern shown below; the same one used by most of the core Silverlight and WPF controls. Observe that while the PropertyMetadata constructor requires a static delegate for property change notifications, doing instance-specific work in a static method is inconvenient. Therefore, the static method below does the bare minimum before handing execution off to a more appropriate instance method. (Aside: Explicit casts are safe because the DependencyProperty infrastructure is responsible for honoring the contract of the Register call.) The extra level of indirection also provides an opportunity to pass more meaningful parameters to the change handler: the property's old value and its new value. And because the instance method is virtual, subclasses can override it to receive their own notification of property changes easily and efficiently. Working with DependencyProperty can be tricky enough; do yourself a favor and start with a solid foundation.

Good Example

public int MyProperty
{
    get { return (int)GetValue(MyPropertyProperty); }
    set { SetValue(MyPropertyProperty, value); }
}
public static readonly DependencyProperty MyPropertyProperty = DependencyProperty.Register(
    "MyProperty", typeof(int), typeof(MyControl), new PropertyMetadata(0, OnMyPropertyChanged));
private static void OnMyPropertyChanged(DependencyObject d, DependencyPropertyChangedEventArgs e)
{
    ((MyControl)d).OnMyPropertyChanged((int)e.OldValue, (int)e.NewValue);
}
protected virtual void OnMyPropertyChanged(int oldValue, int newValue)
{
    // TODO: Handle property change
}

More information

Do one thing, and do it well [Tip: The CLR wrapper for a DependencyProperty should do its job and nothing more]

Tip

The CLR wrapper for a DependencyProperty should do its job and nothing more

Explanation

The CLR wrapper for a Silverlight/WPF DependencyProperty exists purely as a convenience to the developer. The "real" value of a DependencyProperty is stored by the system and accessed by the GetValue and SetValue methods. In fact, parts of the system will only access the value in that manner (possible examples: XAML parser, storyboard animations, etc.). And even if that weren't the case, the fact that the DependencyProperty field is public means that other parts of an application might do so as well (and there is no way of knowing when or stopping them). Therefore, it's not possible to ensure that any custom logic added to the CLR property's set or get wrapper implementation will run every time the DependencyProperty is accessed. Unless you're a fan of inconsistent state, hard to find bugs, or the like, it is typically unwise to violate this convention.

Good Example

public int MyProperty
{
    get { return (int)GetValue(MyPropertyProperty); }
    set { SetValue(MyPropertyProperty, value); }
}

More information

My new home page, refreshed [Updated collection of great Silverlight/WPF Data Visualization resources!]

Some great content has been published since I posted my previous collection of Silverlight/WPF Charting links. What's more, the November 2009 release of the Silverlight Toolkit and the February 2010 release of the WPF Toolkit have both been released, so please have a look at them if you haven't already!

Now, without further ado, here are all links that are fit to print (FYI: previously published links are gray):

Overviews (100 level)

Scenarios (200 level)

Internals (300 level)

Team Member posts (Partner level)

My posts (Ego level)

My many thanks go out to everyone who has spent time helping people learn how to use Silverlight/WPF Data Visualization!

PS - If I've missed any good resources, please leave a comment with a link - I'm always happy to find more great content! :)

PPS - The most recent version of this collection will always be pointed to by http://cesso.org/r/DVLinks. If you're going to create a favorite or link to this post, please use that URL so you'll always be up to date.

Turn your head and check out this post [How to: Easily rotate the axis labels of a Silverlight/WPF Toolkit chart]

When someone asked me how to rotate the axis labels of a chart from the Data Visualization package of the Silverlight Toolkit/WPF Toolkit earlier today, I realized it was time for a quick blog post. Because when I've answered a question two or three times, it's usually a pretty good sign that I'll keep on answering it for some time. I usually try to head that kind of thing off at the pass, so here's my post on the topic for the benefit of future generations. :)

The typical scenario here is that someone has a chart and it's working well, but their axis labels are very long and end up overlapping - even after the default axis behavior of putting them in alternating rows to prevent such a problem kicks in:

Overlapping axis labels


The typical solution is to rotate the axis labels - and it's easy once you know where to look. The key here is to customize the Template of the AxisLabel instances that are used to render the labels. And it's quite simple to do so by providing a Style with a Template Setter for the AxisLabelStyle property of the Axis subclass in question:

Rotated axis labels on WPF

Yeah, it looks great on paper; but that description was a mouthful...

It's probably easier to understand in XAML - here's the complete code for the sample above with the interesting part highlighted:

<Window x:Class="WpfApplication1.MainWindow"
        xmlns="http://schemas.microsoft.com/winfx/2006/xaml/presentation"
        xmlns:x="http://schemas.microsoft.com/winfx/2006/xaml"
        xmlns:charting="clr-namespace:System.Windows.Controls.DataVisualization.Charting;assembly=System.Windows.Controls.DataVisualization.Toolkit"
        xmlns:sys="clr-namespace:System;assembly=mscorlib"
        xmlns:spec="clr-namespace:System.Collections.Specialized;assembly=System"
        Title="RotatedAxisLabelsWPF"
        Width="500"
        Height="350">
    <Grid>
        <charting:Chart
            Title="Animals With Long Names">
            <charting:ColumnSeries
                Title="Character count"
                DependentValueBinding="{Binding Length}"
                IndependentValueBinding="{Binding}">
                <charting:ColumnSeries.ItemsSource>
                    <spec:StringCollection>
                        <sys:String>Bumblebee</sys:String>
                        <sys:String>Caterpillar</sys:String>
                        <sys:String>Hippopotamus</sys:String>
                        <sys:String>Rhinoceros</sys:String>
                        <sys:String>Velociraptor</sys:String>
                    </spec:StringCollection>
                </charting:ColumnSeries.ItemsSource>
                <charting:ColumnSeries.IndependentAxis>
                    <charting:CategoryAxis
                        Orientation="X">
                        <charting:CategoryAxis.AxisLabelStyle>
                            <Style TargetType="charting:AxisLabel">
                                <Setter Property="Template">
                                    <Setter.Value>
                                        <ControlTemplate TargetType="charting:AxisLabel">
                                            <TextBlock Text="{TemplateBinding FormattedContent}">
                                                <TextBlock.LayoutTransform>
                                                    <RotateTransform Angle="-60"/>
                                                </TextBlock.LayoutTransform>
                                            </TextBlock>
                                        </ControlTemplate>
                                    </Setter.Value>
                                </Setter>
                            </Style>
                        </charting:CategoryAxis.AxisLabelStyle>
                    </charting:CategoryAxis>
                </charting:ColumnSeries.IndependentAxis>
            </charting:ColumnSeries>
        </charting:Chart>
    </Grid>
</Window>

Like I said, it's all pretty standard stuff once you know where to look. Of course, you can rotate the labels all the way to 90 degrees if you want them to take the least amount of space possible. But 60 degrees seemed like a suitably rakish angle. ;)


Unfortunately, we can't declare "Mission Accomplished" quite yet... While the Data Visualization assembly itself works exactly the same on WPF and Silverlight, the platforms themselves aren't identical quite yet. Specifically, there's no support for LayoutTransform in Silverlight (and RenderTransform is simply not appropriate here). Fortunately, I've filled the LayoutTransform gap with my LayoutTransformer class - and it's already part of the Silverlight Toolkit!

The syntax changes just a bit, but the concept is exactly the same:

<UserControl x:Class="SilverlightApplication1.MainPage"
    xmlns="http://schemas.microsoft.com/winfx/2006/xaml/presentation"
    xmlns:x="http://schemas.microsoft.com/winfx/2006/xaml"
    xmlns:charting="clr-namespace:System.Windows.Controls.DataVisualization.Charting;assembly=System.Windows.Controls.DataVisualization.Toolkit"
    xmlns:sys="clr-namespace:System;assembly=mscorlib"
    xmlns:toolkit="clr-namespace:System.Windows.Controls;assembly=System.Windows.Controls.Toolkit"
    xmlns:layout="clr-namespace:System.Windows.Controls;assembly=System.Windows.Controls.Layout.Toolkit">
    <Grid>
        <charting:Chart
            Title="Animals With Long Names">
            <charting:ColumnSeries
                Title="Character count"
                DependentValueBinding="{Binding Length}"
                IndependentValueBinding="{Binding}">
                <charting:ColumnSeries.ItemsSource>
                    <toolkit:ObjectCollection>
                        <sys:String>Bumblebee</sys:String>
                        <sys:String>Caterpillar</sys:String>
                        <sys:String>Hippopotamus</sys:String>
                        <sys:String>Rhinoceros</sys:String>
                        <sys:String>Velociraptor</sys:String>
                    </toolkit:ObjectCollection>
                </charting:ColumnSeries.ItemsSource>
                <charting:ColumnSeries.IndependentAxis>
                    <charting:CategoryAxis
                        Orientation="X">
                        <charting:CategoryAxis.AxisLabelStyle>
                            <Style TargetType="charting:AxisLabel">
                                <Setter Property="Template">
                                    <Setter.Value>
                                        <ControlTemplate TargetType="charting:AxisLabel">
                                            <layout:LayoutTransformer>
                                                <layout:LayoutTransformer.LayoutTransform>
                                                    <RotateTransform Angle="-60"/>
                                                </layout:LayoutTransformer.LayoutTransform>
                                                <TextBlock Text="{TemplateBinding FormattedContent}"/>
                                            </layout:LayoutTransformer>
                                        </ControlTemplate>
                                    </Setter.Value>
                                </Setter>
                            </Style>
                        </charting:CategoryAxis.AxisLabelStyle>
                    </charting:CategoryAxis>
                </charting:ColumnSeries.IndependentAxis>
            </charting:ColumnSeries>
        </charting:Chart>
    </Grid>
</UserControl>

Mission accomplished:

Rotated axis labels on Silverlight


There you have it: AxisLabelStyle is your new best friend. A friend with benefits, one might say, because there are other cool things you can do by customizing the AxisLabel Style.

So please: go forth and enjoy your new friend!

This is what happens when two Toolkits fall in love... [The February 2010 release of the WPF Toolkit is now available!]

The WPF Toolkit team has just published the February 2010 release of the WPF Toolkit! In addition to a variety of bug fixes for DataGrid, DatePicker, Calendar, and Visual State Manager, this release also includes the latest changes to the Data Visualization assembly for Silverlight and WPF, bringing the official WPF implementation up to date with the November 2009 release of the Silverlight Toolkit. And because sharing the Silverlight Toolkit's Data Visualization assembly with WPF Toolkit customers has worked out so well, this release of the WPF Toolkit introduces three other controls from the Silverlight Toolkit: AutoCompleteBox (SDK documentation), Accordion, and Rating!


WPF Toolkit February 2010 installer


Just as with the Data Visualization assembly, the WPF Toolkit implementation of AutoCompleteBox, Accordion, and Rating are almost identical copies of the latest Silverlight Toolkit implementations - we've even kept the same assembly names and structure. Therefore, everything you already know and love about these controls on Silverlight (including your code and XAML) should translate seamlessly to WPF! Even the Visual Studio 2008 design-time experience for these controls should be the same; we've brought the Visual Studio design-time assemblies over, too!

These controls have been part of the Silverlight Toolkit long enough that there are plenty of great resources on the web for information, examples, and more. I expect WPF developers will come up to speed quickly and be able to start taking advantage of them in WPF applications in no time! :)


Aside: This release of the WPF Toolkit targets the version of WPF that is part of .NET 3.5 (just as previous releases did). There isn't a version of the WPF Toolkit specifically for .NET 4 - largely because many of the controls in the WPF Toolkit were folded into WPF 4 itself!


Those of you who follow the progress of the Data Visualization project already know that I maintain a collection of helpful links from all over the web here: http://cesso.org/r/DVLinks. Another handy resource for new users is my DataVisualizationDemos sample project which runs on Silverlight 3, Silverlight 4, WPF 3.5, and WPF 4 and provides examples of a bunch of different things made possible by the Data Visualization project. Finally, there are some WPF Toolkit-specific notes that are part of my WPF Toolkit June 2009 announcement and which may be worth reviewing. (In particular, the "Build Notes" section covers an issue that occasionally trips people up when trying to compile the design-time assemblies themselves.)


Release notes: For a summary of the changes to the WPF version of Data Visualization since the June 2009 WPF Toolkit and numerous code/XAML examples, please have a look at my announcements for the July 2009, October 2009, and November 2009 releases of the Silverlight Toolkit.


It's always exciting when there's a new Toolkit release - and a bit of a relief because there's a lot of work that goes on behind the scenes to make these possible. I'd like to thank the WPF Toolkit team for their continued support of Data Visualization and for their willingness to include additional controls from the Silverlight Toolkit. In particular, I'd like to thank Patrick Danino who did nearly all the work to port the three new controls over to WPF, test them, and resolve a few platform incompatibilities that came up! His efforts went well beyond what I expected when he and I first talked about the idea and it has been a pleasure working with him on this. If any bugs happened to sneak through, it's not for lack of effort on Patrick's part. :) Please don't blame him - blame me instead!

This one time, at band camp... [A banded StackPanel implementation for Silverlight and WPF!]

Recently, I came across this article in the Expression Newsletter showing how to create a three-column ListBox. In it, Victor Gaudioso shows a Blend-only technique for creating a Silverlight/WPF ListBox with three columns. [And I award him extra credit for using the Silverlight Toolkit to do so! :) ] The technique described in that article is a great way to custom the interface layout without writing any code.

But it can get a little harder when the elements in the ListBox aren't all the same size: a row with larger elements may only be able to fit two items across before wrapping, while a row with smaller elements may fit four items or more! Such things can typically be avoided by specifying the exact size of all the items and the container itself (otherwise the user might resize the window and ruin the layout). But while hard-coding an application's UI size can be convenient at times, it's not always an option.


For those times when it's possible to write some code, specialized layout requirements can usually be implemented more reliably and more accurately with a custom Panel subclass. Victor started by looking for a property he could use to set the number of columns for the ListBox, and there's nothing like that by default. So I've written some a custom layout container to provide it - and because I've created a new Panel, this banded layout can be applied anywhere in an application - not just inside a ListBox!

The class I created is called BandedStackPanel and it behaves like a normal StackPanel, except that it includes a Bands property to specify how many vertical/horizontal bands to create. When Bands is set to its default value of 1, BandedStackPanel looks the same as StackPanel - when the value is greater than 1, additional bands show up automatically! And because BandedStackPanel is an integral part of the layout process, it's able to ensure that there are always exactly as many bands as there should be - regardless of how big or small the elements are and regardless of how the container is resized.


Vertical BandedStackPanel on Silverlight


[Click here to download the source code for BandedStackPanel and the Silverlight/WPF sample application in a Visual Studio 2010 solution]


The sample application shown here has a test panel on the left to play around with and a ListBox at the right to demonstrate how BandedStackPanel can be used to satisfy the original requirements of the article. The ComboBoxes at the top of the window allow you to customize the behavior of both BandedStackPanel instances. And, of course, BandedStackPanel works great on WPF as well as on Silverlight. :)


Horizontal BandedStackPanel on WPF


The way to use BandedStackPanel with a ListBox is the same as any other ItemsControl layout customization: via the ItemsControl.ItemsPanel property:

<ListBox>
    <ListBox.ItemsPanel>
        <ItemsPanelTemplate>
            <delay:BandedStackPanel Bands="3"/>
        </ItemsPanelTemplate>
    </ListBox.ItemsPanel>
    <ListBoxItem Content="ListBoxItem 0"/>
    <ListBoxItem Content="ListBoxItem 1"/>
    <ListBoxItem Content="ListBoxItem 2"/>
    ...
</ListBox>


That's pretty much all there is to it! The Silverlight/WPF layout system is very powerful and can be made to do all kinds of weird and wonderful things without writing a single line of code. But for those times when your needs are very specific, nothing beats a custom Panel for really nailing the scenario!


PS - The implementation of BandedStackPanel is fairly straightforward. The only real complexity is abstracting out the handling of both the horizontal and vertical orientations so the same code can be used for both. I followed much the same approach the Silverlight Toolkit's WrapPanel uses and introduced a dedicated OrientedLength class that allows the code to deal in terms of primary/secondary growth directions instead of specifically manipulating width and height. Once the abstraction of OrientedLength is in place, the implementations of MeasureOverride and ArrangeOverride are pretty much what you'd expect. Here they are for those who might be interested:

/// <summary>
/// Implements custom measure logic.
/// </summary>
/// <param name="constraint">Constraint to measure within.</param>
/// <returns>Desired size.</returns>
protected override Size MeasureOverride(Size constraint)
{
    var bands = Bands;
    var orientation = Orientation;
    // Calculate the Size to Measure children with
    var constrainedLength = new OrientedLength(orientation, constraint);
    constrainedLength.PrimaryLength = double.PositiveInfinity;
    constrainedLength.SecondaryLength /= bands;
    var availableLength = constrainedLength.Size;
    // Measure each child
    var band = 0;
    var levelLength = new OrientedLength(orientation);
    var usedLength = new OrientedLength(orientation);
    foreach (UIElement child in Children)
    {
        child.Measure(availableLength);
        // Update for the band/level of this child
        var desiredLength = new OrientedLength(orientation, child.DesiredSize);
        levelLength.PrimaryLength = Math.Max(levelLength.PrimaryLength, desiredLength.PrimaryLength);
        levelLength.SecondaryLength += desiredLength.SecondaryLength;
        // Move to the next band
        band = (band + 1) % bands;
        if (0 == band)
        {
            // Update for the complete level; reset for the next one
            usedLength.PrimaryLength += levelLength.PrimaryLength;
            usedLength.SecondaryLength = Math.Max(usedLength.SecondaryLength, levelLength.SecondaryLength);
            levelLength.PrimaryLength = 0;
            levelLength.SecondaryLength = 0;
        }
    }
    // Update for the partial level at the end
    usedLength.PrimaryLength += levelLength.PrimaryLength;
    usedLength.SecondaryLength = Math.Max(usedLength.SecondaryLength, levelLength.SecondaryLength);
    // Return the used size
    return usedLength.Size;
}

/// <summary>
/// Implements custom arrange logic.
/// </summary>
/// <param name="arrangeSize">Size to arrange to.</param>
/// <returns>Used size.</returns>
protected override Size ArrangeOverride(Size arrangeSize)
{
    var bands = Bands;
    var orientation = Orientation;
    var count = Children.Count;
    // Prepare the Rect to arrange children with
    var arrangeLength = new OrientedLength(orientation, arrangeSize);
    arrangeLength.SecondaryLength /= bands;
    // Arrange each child
    for (var i = 0; i < count; i += bands)
    {
        // Determine the length of the current level
        arrangeLength.PrimaryLength = 0;
        arrangeLength.SecondaryOffset = 0;
        for (var band = 0; (band < bands) && (i + band < count); band++)
        {
            var desiredLength = new OrientedLength(orientation, Children[i + band].DesiredSize);
            arrangeLength.PrimaryLength = Math.Max(arrangeLength.PrimaryLength, desiredLength.PrimaryLength);
        }
        // Arrange each band within the level
        for (var band = 0; (band < bands) && (i + band < count); band++)
        {
            Children[i + band].Arrange(arrangeLength.Rect);
            arrangeLength.SecondaryOffset += arrangeLength.SecondaryLength;
        }
        // Update for the next level
        arrangeLength.PrimaryOffset += arrangeLength.PrimaryLength;
    }
    // Return the arranged size
    return arrangeSize;
}

The customer is always right [Updated free tool and source code to prevent a machine from going to sleep!]

It was a few months back that I released Insomnia, a simple utility to prevent a computer from entering sleep mode. (For more on why that can be desirable (or other details about what Insomnia is and how it works), please refer to the original post.) Insomnia is a very simple program (it boils down to a single Win32 API call), but it fills a need many of us have - and the feedback I've gotten has been much appreciated!


Insomnia application

[Click here to download the Insomnia application along with its complete source code.]


My original post explains why Insomnia makes its window Topmost: "so it's always visible and people will be less likely to accidentally leave their computers sleep-less". My reasoning made plenty of sense to me (obviously!), but I received some public and private requests (like these) to add the ability to minimize Insomnia to the tray. I'm not one to argue with customers, so I decided to spend a commute adding the requested feature. Fortunately, I've already written and shared a WPF-based "minimize to tray" implementation, so I added that file to the Insomnia project and pasted the single line of code it took to enable "minimize to tray". And though I was done, I still had most of the bus ride left... :)


Insomnia minimized to the tray


So I figured I'd address the other popular request while I was at it: the ability to start Insomnia already minimized. To do that, I added the following code to the constructor which looks for a "-minimize" argument on the command-line and starts Insomnia minimized when it's present:

// Start minimized if requested via the command-line
foreach (var arg in Environment.GetCommandLineArgs())
{
    if (0 == string.Compare(arg, "-minimize", true))
    {
        Loaded += delegate { WindowState = WindowState.Minimized; };
    }
}
Aside: Because I'm using the Loaded event, there can be a brief instant where Insomnia shows up on the screen before minimizing itself. While my initial implementation actually set the Minimized state directly from the constructor, there's enough going on at that point (and enough non-standard window settings in Insomnia) that WPF got confused and showed a small, empty window even though the application was minimized. I probably could have added more code to suppress that, but this implementation is so clean and obvious about what it's doing that I didn't want to trade it in for an alternate one that would be more complex and hacky.


You know, when everything is said and done, I find that I really like Insomnia's new ability to get out of the way by minimizing to the tray. :) So thanks for everyone's feedback here - and please keep the great suggestions coming!


PS - If you want a simple way to start Insomnia minimized, create a customized shortcut:

  1. Right-click on the Insomnia program
  2. Choose "Create shortcut"
  3. Right-click on "Insomnia - Shortcut"
  4. Choose "Properties"
  5. Add  -minimize to the end of the command line
  6. Press OK
  7. Optionally: Move that shortcut to the "Startup" folder in the Start Menu to have Insomnia start minimized every time you log in to Windows
Editing Insomnia shortcut

Sometimes it takes a village to solve a problem [Workaround for a Visual Studio 2008 design-time issue with the WPF Toolkit when Blend 3 is installed]

Back in June, the "WPF" half of Silverlight/WPF Charting made its first official appearance with the release of the June 2009 WPF Toolkit. Having Charting be part of both the Silverlight Toolkit and the WPF Toolkit was always a goal of mine and I've heard from lots of customers who are using Charting with great success on WPF. By and large, everyone's feedback has been positive and the community enthusiasm has been fantastic to see!

Unfortunately there's one problem that's come up a few times which nobody really had enough context to solve. A user with Visual Studio 2008 and the June 2009 WPF Toolkit installed would be happily using the Data Visualization assembly (Charting) in their projects and everything would be working fine for weeks on end. Then one day they'd install Blend 3 and all of a sudden Visual Studio 2008 would fail trying to open the Charting project with a confusing "Problem Loading" error from the design surface:

'/Microsoft.Windows.Design.Developer;component/themes/GridAdorners.xaml' value cannot be assigned to property 'Source' of object 'System.Windows.ResourceDictionary'. Cannot create instance of 'GenericTheme' defined in assembly 'Microsoft.Windows.Design.Interaction, Version=3.5.0.0, Culture=neutral, PublicKeyToken=b03f5f7f11d50a3a'. Exception has been thrown by the target of an invocation.

The first thing most people would try is uninstalling Blend 3 - which fortunately "fixes" the problem - but makes for a crummy long-term solution...

Fortunately, we managed to get the right people from the Silverlight Toolkit, Blend 3, and Visual Studio 2008 teams in a room a few days ago to hash this out. The first bit of good news is that we did sort out enough of what's going on to come up with an easy workaround. The second bit of good news is that I've already made a change to the WPF Toolkit source code so the next official release won't trigger this problem. And the third bit of good news is that they're going to make sure the underlying issue is addressed in Visual Studio 2010 so this doesn't come up again!

Here's the official synopsis of the problem and the steps to implement the simple workaround:

Known Issue with WPF Toolkit June 2009, Visual Studio 2008, and Blend 3

If a customer has Visual Studio 2008, WPF Toolkit June 2009, and Blend 3 installed, and the WPF project in Visual Studio 2008 has a reference to System.Windows.Controls.DataVisualization.Toolkit.dll, you may see the following error message when opening the project or loading the designer:

Error 1 '/Microsoft.Windows.Design.Developer;component/themes/GridAdorners.xaml' value cannot be assigned to property 'Source' of object 'System.Windows.ResourceDictionary'. Cannot create instance of 'GenericTheme' defined in assembly 'Microsoft.Windows.Design.Interaction, Version=3.5.0.0, Culture=neutral, PublicKeyToken=b03f5f7f11d50a3a'. Exception has been thrown by the target of an invocation. Error at object 'ResourceDictionary_4'.

The problem can be triggered by dragging the Chart control from WPF Toolkit June 2009 from the Toolbox onto the WPF designer in Visual Studio.

To resolve this issue, use the following workaround:

From an account with elevated/administrative permissions, in the WPF Toolkit June 2009 install directory on the machine (typically "C:\Program Files\WPF Toolkit\v3.5.40619.1"):

  1. Rename System.Windows.Controls.DataVisualization.Toolkit.Design.dll to System.Windows.Controls.DataVisualization.Toolkit.Design.4.0.dll
  2. Rename System.Windows.Controls.DataVisualization.Toolkit.Design.pdb to System.Windows.Controls.DataVisualization.Toolkit.Design.4.0.pdb

Thank you for everyone's patience as we sorted this out. I wish we could have done so sooner, but I'm really glad we seem to have gotten to the bottom of it at last!


PS - If you still have problems after applying the fix, please let us know!

"I feel the need... the need for SPEED!" [Seven simple, performance-boosting tweaks for common Silverlight/WPF Charting scenarios]

No matter how fast things are, they never seem to be fast enough. Even if we had the world's most optimized code in the Silverlight/WPF Data Visualization assembly, I bet there would still be a couple of people who wanted better performance. :) Unfortunately, we have don't have the world's most optimized code, and performance concerns represent one of the most common customer issues with Charting. While I wish we had the resources to commit to a few weeks of focused performance work, things just haven't panned out like that so far.

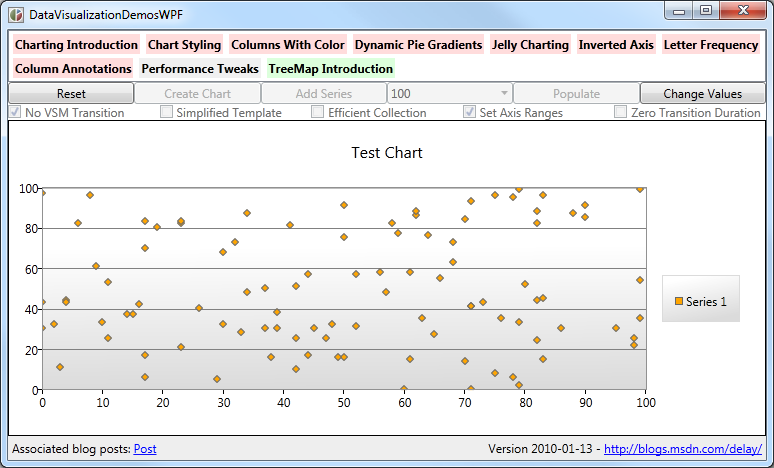
Instead, I've got the next best thing: a collection of simple changes anyone can make to noticeably improve the performance of common scenarios with today's bits! To demonstrate the impact of each of these tips, I've created a new "Performance Tweaks" tab in my DataVisualizationDemos sample application. The controls on this new page let you pick-and-choose which optimizations you'd like to see - then allow you to run simple scenarios to get a feel for how effective those tweaks are. And because DataVisualizationDemos compiles for and runs on Silverlight 3, Silverlight 4, WPF 3.5, and WPF 4, it's easy to get a feel for how much benefit you can expect to see on any supported platform.

For each of the seven tips below, I list simple steps that show the performance benefit of the tip using the new sample page. Performance improvements are best experienced in person, so I encourage interested readers to download the demo and follow along at home! :)


[Click here to download the complete source code for the cross-platform DataVisualizationDemos sample application.]


Performance Tweaks Demo


Tip: Use fewer data points

Okay, this first tip is really obvious - but it's still valid! Fewer data points means less to process, less to manage, and less to render - all of which mean that scenarios with few points to tend to be faster and smoother than those with many points. You can often reduce the number of points in a scenario by plotting fewer values, aggregating similar values together, or by showing subsets of the whole data. This approach isn't always practical, but when it is, it's usually a big win - and has the added benefit that the resulting chart is less cluttered and can even be easier to understand!

Aside: Typical performance guidance for Silverlight and WPF recommends capping the total number of UI elements in the low- to mid-hundreds. Given that each of Charting's DataPoint instances instantiates around 5 UI elements, it's easy to see why rendering a chart with 1000 data points can start to bog the system down.

Slow: Reset, check only Simplified Template, Create Chart, Add Series, 1000 points, Populate

Fast: Reset, check only Simplified Template, Create Chart, Add Series, 50 points, Populate


Tip: Turn off the fade in/out VSM animations

By default, data points fade in and fade out over the period of a half second. This fade is controlled by a Visual State Manager state transition in the usual manner and therefore each DataPoint instance runs its own private animation. When there are lots of data points coming and going, the overhead of all these parallel animations can start to slow things down. Fortunately, the DataPoint classes are already written to handle missing states, so getting rid of these animations is a simple matter of modifying the default Template to remove the "RevealStates"/"Shown" and/or "RevealStates"/"Hidden" states.

Slow: Reset, uncheck everything, Create Chart, Add Series, 100 points, Populate

Fast: Reset, check only No VSM Transition, Create Chart, Add Series, 100 points, Populate


Tip: Change to a simpler DataPoint Template

I mentioned above that overwhelming the framework with lots of UI elements can slow things down. So in cases where it's not possible to display fewer points, it's still possible to display fewer elements by creating a custom Template that's simpler than the default. There is a lot of room here to creatively balance simplicity (speed) and visual appeal (attractiveness) here, but for the purposes of my demonstration, I've gone with something that's about as simple as it gets:

<Style x:Key="SimplifiedTemplate" TargetType="charting:ScatterDataPoint">
    <Setter Property="Template">
        <Setter.Value>
            <ControlTemplate TargetType="charting:ScatterDataPoint">
                <Grid
                    Width="5"
                    Height="5"
                    Background="{TemplateBinding Background}"/>
            </ControlTemplate>
        </Setter.Value>
    </Setter>
</Style>
Aside: This tip and the previous one are the only two tips that are mutually exclusive (because they both involve providing a custom DataPointStyle for the series). Otherwise, you have complete freedom to mix-and-match whatever tweaks work well for your scenario!

Slow: Reset, uncheck everything, Create Chart, Add Series, 100 points, Populate

Fast: Reset, check only Simplified Template, Create Chart, Add Series, 100 points, Populate


Tip: Specify fixed ranges for the axes

For convenience and ease-of-use, Charting's axes automatically analyze the data that's present in order to provide reasonable default values for their minimum, maximum, and interval. This works quite well in practice and you should hardly ever have to override the automatic range. However, the code that determines the automatic axis ranges isn't free. This cost isn't significant for static data, but if the underlying values are changing a lot, the small cost can accumulate and become noticeable. If you're fortunate enough to know the ranges over which your data will vary, explicitly specifying the axes and giving them fixed ranges will completely eliminate this overhead.

Slow: Silverlight 3, Reset, uncheck everything, Create Chart, Add Series, 100 points, Populate, Change Values

Fast: Silverlight 3, Reset, check only Set Axis Ranges, Create Chart, Add Series, 100 points, Populate, Change Values


Tip: Add the points more efficiently

Silverlight/WPF Charting is built around a model where any changes to the data are automatically shown on the screen. This is accomplished by detecting classes that implement the INotifyPropertyChanged interface and collections that implement the INotifyCollectionChanged interface and registering to find out about changes as they occur. This approach is incredibly easy for developers because it means all they have to touch is their own data classes - and Charting handles everything else! However, this system can be counterproductive in one scenario: starting with an empty collection and adding a bunch of data points all at once. By default, each new data point generates a change notification which prompts Charting to re-analyze the data, re-compute the axis properties, re-layout the visuals, etc.. It would be more efficient to add all the points at once and then send a single notification to Charting that its data has changed. Unfortunately, the otherwise handy ObservableCollection class doesn't offer a good way of doing this. Fortunately, it's pretty easy to add:

// Custom class adds an efficient AddRange method for adding many items at once
// without causing a CollectionChanged event for every item
public class AddRangeObservableCollection<T> : ObservableCollection<T>
{
    private bool _suppressOnCollectionChanged;

    public void AddRange(IEnumerable<T> items)
    {
        if (null == items)
        {
            throw new ArgumentNullException("items");
        }
        if (items.Any())
        {
            try
            {
                _suppressOnCollectionChanged = true;
                foreach (var item in items)
                {
                    Add(item);
                }
            }
            finally
            {
                _suppressOnCollectionChanged = false;
                OnCollectionChanged(new NotifyCollectionChangedEventArgs(NotifyCollectionChangedAction.Reset));
            }
        }
    }

    protected override void OnCollectionChanged(NotifyCollectionChangedEventArgs e)
    {
        if (!_suppressOnCollectionChanged)
        {
            base.OnCollectionChanged(e);
        }
    }
}

Slow: Reset, uncheck everything, Create Chart, Add Series, 500 points, Populate

Fast: Reset, check only Efficient Collection, Create Chart, Add Series, 500 points, Populate


Tip: Disable the data change animations

Because people perceive changes better when they're able to see the change happening, Charting animates all value changes to the underlying data points. So instead of a bar in a bar chart suddenly getting longer when its bound data value changes, the bar smoothly animates from its old value to its new value. This approach has another benefit: it calls attention to the value that's changed in a way that an instantaneous jump wouldn't. However, animating value changes can take a toll when there are lots of changes happening at the same time or when there are a continuous stream of changes over a long time. In cases like these, it can be helpful to lessen the default duration of the animation (a half second) by lowering the value of the series's TransitionDuration property - all the way down to 0 if that's what it takes.

Slow: Silverlight 3, Reset, uncheck everything, Create Chart, Add Series, 100 points, Populate, Change Values

Fast: Silverlight 3, Reset, check only Zero Transition Duration, Create Chart, Add Series, 100 points, Populate, Change Values


Tip: Use a different platform or version

Though they offer basically identical APIs, Silverlight and WPF are implemented very differently under the covers - and what performs poorly on one platform may run quite well on the other. Even staying with the same platform, Silverlight 4 contains a number of improvements relative to Silverlight 3 (as does WPF 4 vs. WPF 3.5). Therefore, if you have the freedom to choose your target platform, a bit of prototyping early on may help to identify the best choice for your scenario.

Slow: Silverlight 3, Reset, uncheck everything, Create Chart, Add Series, 100 points, Populate, Change Values

Fast: WPF 3.5, Reset, uncheck everything, Create Chart, Add Series, 100 points, Populate, Change Values