The blog of dlaa.me

Posts from June 2009

WPF Charting: It's official! [June 2009 release of the WPF Toolkit is now available!]

The WPF Toolkit team just published the June 2009 release of the WPF Toolkit. Those of you who know I'm on the Silverlight Toolkit team are probably wondering why this is relevant - so let's get right to the release notes for the next version of Silverlight/WPF Charting because they'll clear things up:


Notable Changes

WPF is now an official platform for Charting! Today's release of the June 2009 WPF Toolkit includes the binaries for WPF Charting, the associated design-time assemblies for both Visual Studio 2008 and Blend 3, and the complete source code for everything (under the usual Ms-PL license). Prior to today, WPF Charting only existed informally because of a blog post I'd written and some bits I'd shared. As of today, that "do it yourself" approach is a thing of the past - customers can get signed binaries and ready-to-build source code for Charting as part of the WPF Toolkit. And, as always, Charting exposes the same API and supports the same XAML on both platforms - making application portability trivial!

WPF Toolkit installer

Improved performance of internal data structures for many common scenarios. Charting now makes use of left-leaning red-black trees to maintain properly balanced data structures. For more detail on this change, please refer to my post about the LeftLeaningRedBlackTree implementation.

Numerous bug fixes for animation inconsistencies between Silverlight and WPF. Storyboards and Animations sometimes behave a little differently on Silverlight/WPF, and a good bit of effort was spent trying to ensure that Charting will behave the same way on both platforms. In most cases, this was a matter of finding an implementation both platforms agreed on - in some it meant resorting to small, localized #if blocks.

Fixed handling of data objects with non-unique hash codes. When each data object had a unique hash code, things already worked fine. But data sets containing items sharing the same hash code could exhibit incorrect behavior in previous releases. Most typical data sets would not have encountered this problem because hash codes are nearly always unique - but there are certain classes that report quite UNunique hash codes and could trigger the problem fairly easily. This is no longer an issue.

Corrected behavior of charts at very small sizes and during animations. Some third party controls offer so-called "fluid" layout in which size changes are all animated and elements can easily shrink to a size of 0x0. This kind of environment could previously trigger layout bugs that would result in an unhandled exception from the Chart control. These issues have been fixed and dynamic layout changes are now handled seamlessly.

Breaking Changes

IRequireGlobalSeriesIndex's GlobalSeriesIndexChanged method takes a nullable int parameter. This should affect only people who have written custom Series implementations - and the code change is a trivial.

Other Changes

Many other fixes and improvements.

  • Proper RoutedEvent support for DataPointSeries.SelectionChangedEvent
  • Better handling of non-double data by shared Series
  • Addition of StrokeMiterLimit to the Polyline used by LineSeries
  • Fixes for edge case scenarios when removing a Series
  • Ability to set Series.Title with a Binding (on Silverlight 3 and WPF)
  • Automatic inheritance of the Foreground property by the Title control
  • Visual improvements to the LegendItem DataPoint marker
  • Addition of SnapsToDevicePixels to the default Chart Template (WPF-only; unnecessary on Silverlight)

Build Notes

If you plan to recompile the WPF Toolkit from source, please be aware that two of the three Charting design-time assemblies reference Blend 3 DLLs Microsoft.Windows.Design.Extensibility.dll and Microsoft.Windows.Design.Interaction.dll. Unlike their Visual Studio counterparts, these design-time assemblies are not automatically found by the build and their absence causes 84 build errors in the Controls.DataVisualization.Toolkit.Design and Controls.DataVisualization.Toolkit.Expression.Design projects. :(

Most people won't care about building the Blend-specific design-time assemblies and can simply right-click the two failing projects in Visual Studio and choose "Unload Project". After that, everything builds successfully.

Alternatively, users with Blend installed can update these projects' references to both assemblies and then everything (including the Blend design-time assemblies!) builds successfully. The default location of the Blend assemblies is something like C:\Program Files (x86)\Microsoft Expression\Blend 3 Beta. (If you're on a 32-bit OS, remove the " x86"; once Blend releases, remove the " Beta".

Sorry for the inconvenience - we didn't want to ship pre-release Blend components with the WPF Toolkit.


Long-time readers know that I always include some new Charting samples with my release notes to showcase new features. The big feature here is WPF Charting, so I've put together a solution that contains almost all of the public Charting samples I've ever posted to my blog - now in one handy place! Naturally, the DataVisualizationDemos sample runs on both Silverlight (2 or 3!) and WPF with the exact same code and XAML. And it includes a brand new scenario called "Letter Frequency" that I wrote to help test some of the recent changes.

Here it is on WPF:

DataVisualizationDemos Letter Frequency sample

Click here to download the complete source code for the DataVisualizationDemos sample application.

(Note: To find the blog post associated with each sample, please refer to the "My posts" section of my Charting Links collection.)


Jafar and I spent most of the previous release cycle helping other teams with their deliverables, so we didn't get as nearly much time to spend on Charting as we would have liked. [Otherwise the release notes would be much longer! :) ] Fortunately, we did make the time to deliver some good fixes for this release and that should help make customers' lives a little easier. Of course, while we've done our best to make Charting as useful and problem-free as possible, there's always room for improvement...

So if you have any questions or feedback, the right places to start are the Silverlight Discussion Forum or the WPF Discussion List. Bugs and feature requests can be logged with the Silverlight Issue Tracker or the WPF Issue Tracker. Please raise issues that are clearly unique to one platform or the other in the obvious place. But for general questions and things that are common to both platforms, the Silverlight forum/list is probably a better place - just because there's more context and history there.

A big "thank you" goes out to everyone who's worked with Charting and helped to make it what it is today! Today's release and announcement are specifically directed at the WPF early-adopters who've truly gone the extra mile to use Charting. We thank you for your dedication! Also, my personal thanks go out to the WPF Toolkit team for making this possible - in particular to Samantha Durante, Vamsee Potharaju, and Alexis Roosa for their assistance and support!


PS - If you're a loyal Silverlight Charting user who's feeling a little left out right about now, I have some good news for you, too. :) The Silverlight Toolkit will also be releasing an update fairly soon. And when it does, Silverlight Charting will contain all the fixes described here, one or two others that came in too late to make this release, AND a nice little surprise that will make the wait worthwhile...

Peanut butter jelly time [How to: Create a pleasing visual effect with Silverlight/WPF Charting]

I was recently part of an e-mail thread with Pete Brown discussing the prospects of reproducing Richard Zadorozny's cool "jelly chart" behavior with the official Silverlight/WPF Charting controls from the Silverlight Toolkit. Richard's sample is really fun to play around with - but at the core it's really just a slick user experience demo masquerading as a charting solution. The question was: how hard it would be to take a real-world charting solution and get it to masquerade as a slick user experience demo... :)

I had some particular opinions on how to go about this, and said I'd put together a quick sample to show off my approach. I was aware of this sample when we started work on Silverlight/WPF Charting and made sure that Charting supported two specific things to make this kind of behavior easy: the DataPointSeries.AnimationSequence property and the Reveal/Show VSM state. In fact, I wrote a similar sample that's been part of the public charting samples since our first release. To find it, load the samples, pick the "Column Series" page from the left-hand column, then switch to the "Animation" tab at the top. The "Custom: Grow" samples show off the basic concept - all that's missing is the easing and that's easy (no pun intended) to add via Silverlight 3's built-in support.

However, as I thought about duplicating the jelly scenario for a few moments, I realized line series would be more challenging - because the line's shape tracks the actual data values and isn't covered by a VSM animation the way its points are. Fortunately, I had another trick up my sleeve - and thus the following Silverlight 3 sample was born:


JellyCharting sample

Click here or on the image above to run the sample in your browser.

Click here to download the complete source code for the sample.

While I didn't go out of my way to duplicate every aspect of the original demo, I did try to pay homage to it. :)


My solution is a straightforward IValueConverter implementation (more background) that can be easily dropped into an existing chart to add the cool jelly behavior. For simplicity, my implementation assumes the original data is Points and uses fixed values for delays and stuff - but that's just to keep things easy to read and understand. It would be quite easy to modify or extend what I've done to flexibly support more general scenarios.

Here's the relevant code:

// IValueConverter implementation that creates a "jelly" effect for showing chart data
public class JellyConverter : IValueConverter
{
    // Converts an ICollection of Points to an ICollection of animated JellyPoints
    public object Convert(object value, Type targetType, object parameter, CultureInfo culture)
    {
        // Type-check input
        var originalPoints = value as ICollection<Point>;
        if (null == originalPoints)
        {
            throw new NotImplementedException("JellyConverter only supports value type ICollection<T>.");
        }

        // Fixed paramaters (could be set via properties or parameter)
        var duration = TimeSpan.FromSeconds(0.5);
        var delay = TimeSpan.FromSeconds(0.5);
        var ease = new ElasticEase { Oscillations = 1 };

        // Prepare Storyboard
        var count = originalPoints.Count;
        var jellyPoints = new List<JellyPoint>(count);
        var storyboard = new Storyboard();
        var propertyPath = new PropertyPath("Y");
        var i = 0;

        // For each Point...
        foreach (var originalItem in originalPoints)
        {
            // Add a corresponding JellyPoint
            var jellyPoint = new JellyPoint { X = originalItem.X, Y = 0 };
            jellyPoints.Add(jellyPoint);

            // Create an animation
            var animation = new DoubleAnimationUsingKeyFrames();
            Storyboard.SetTarget(animation, jellyPoint);
            Storyboard.SetTargetProperty(animation, propertyPath);

            // Configure the initial delay and "jelly" behavior
            var thisDelay = TimeSpan.FromSeconds(delay.TotalSeconds * ((i + 1.0) / count));
            animation.KeyFrames.Add(new LinearDoubleKeyFrame
            {
                KeyTime = thisDelay,
                Value = 0
            });
            animation.KeyFrames.Add(new EasingDoubleKeyFrame
            {
                KeyTime = thisDelay + duration,
                Value = originalItem.Y,
                EasingFunction = ease
            });

            // Add animation to Storyboard
            animation.Duration = thisDelay + duration;
            storyboard.Children.Add(animation);
            i++;
        }

        // Play the Storyboard
        storyboard.Begin();

        return jellyPoints;
    }

    // Custom Point-like class allows easy animation of Y property
    public class JellyPoint : DependencyObject, INotifyPropertyChanged
    {
        // Static X value
        public double X { get; set; }

        // Dynamic Y value
        public static readonly DependencyProperty YProperty = DependencyProperty.Register(
            "Y", typeof(double), typeof(JellyPoint), new PropertyMetadata(YPropertyChanged));
        public double Y
        {
            get { return (double)GetValue(YProperty); }
            set { SetValue(YProperty, value); }
        }
        private static void YPropertyChanged(DependencyObject o, DependencyPropertyChangedEventArgs e)
        {
            var jellyPoint = (JellyPoint)o;
            var handler = jellyPoint.PropertyChanged;
            if (null != handler)
            {
                handler.Invoke(jellyPoint, _yPropertyChangedEventArgs);
            }
        }
        private static PropertyChangedEventArgs _yPropertyChangedEventArgs =
            new PropertyChangedEventArgs("Y");

        // INotifyPropertyChanged event
        public event PropertyChangedEventHandler PropertyChanged;
    }

    // Unimplemented/unnecessary method
    public object ConvertBack(object value, Type targetType, object parameter, CultureInfo culture)
    {
        throw new NotImplementedException();
    }
}


Notes:

  • The IValueConverter works by looking at the input Point collection and replacing it with a corresponding collection of JellyPoint objects. These JellyPoint objects are special in that their Y property is a DependencyProperty and can therefore be animated by a Storyboard. Furthermore, they implement the INotifyPropertyChanged interface, so Charting automatically registers to get notifications every time the value changes. That done, a Storyboard is created to animate each of the Y values of the JellyPoints from zero to their target values in left-to-right sequence. An easing function is applied to each animation to give the desired "jelly" effect. And Charting's built-in support for dynamic data automatically does all the rest of the work!
  • Note that DataPointSeries.TransitionDuration is set to 0 so Charting knows not to try to animate each value change itself - that's what the custom Storyboard is doing, after all!
  • You can click the little thumbnail in the upper right of the chart to switch from line to column. The switch is done smoothly with a standard Storyboard - though I do register a Completed event handler so I can bring the new thumbnail to the top after the animation is done. (Recall that when two elements overlap, one of them is always on top - and that role swaps every time the thumbnail is clicked.)
  • I mentioned above that the IValueConverter shouldn't be necessary for the column sample because Charting natively supports everything that's needed - but I used the IValueConverter anyway... What gives? Well, this is one of those things where it's harder to do a sample than it would be to do the real thing... When I run the sample, I always end up clicking the "More jelly!" button like a hyperactive monkey - and Charting wasn't designed for that kind of behavior. Specifically, when the AnimationSequence property is set, the corresponding in- and out-animations are always run to completion. They each have a duration of one second, so when someone goes nuts clicking, the animations start falling behind and the visuals start to lag. Things eventually settle correctly, but I'm not very patient and I used the IValueConverter just in case there are any other click-happy folks out there.


I've always thought the original "jelly charts" sample was really well done - it was fun to reproduce it using a "real" charting package. :)

Maintaining balance [A versatile red-black tree implementation for .NET (via Silverlight/WPF Charting)]

Problem

I spent some time in my last post explaining how Silverlight/WPF Charting takes advantage of an ordered multi-dictionary to improve the performance of various scenarios. I wrote about Charting's use of a custom binary tree implementation and outlined some limitations of that algorithm and our particular implementation of it. In this post, I'm going to explain how we're addressing those limitations for the next release of Charting and share the general purpose code we're using to do it!

The fundamental problem with our current BinaryTree implementation is that offers no guarantee of balance, and can devolve into linear performance even when dealing with fairly typical data. And this isn't an implementation problem - it's an algorithmic one: if you want balancing behavior, you should really use a data structure that balances. (Duh...) One of the most popular data structures for implementing a balanced binary tree is the red-black tree. Red-black trees get their name from the colors they assign to their nodes - which they use to perform various "rotations" on the tree in order to maintain a set of invariants that guarantee the tree remains more-or-less balanced. (I'm not going to go into more detail here; the Wikipedia article is a great resource for learning more.) The "problem" with red-black trees is that they're notoriously tricky to implement correctly - especially the remove scenarios. There are a lot of special cases to deal with, and things can get messy pretty quickly...

Solution

Which is why I was so excited to read about Robert Sedgewick's research paper on "left-leaning red-black trees". (If you want something a little more colorful than a research paper, here's a presentation on the same topic.) Basically, Dr. Sedgewick took advantage of a correspondence between red-black trees and 2-3-4 trees to introduce a constraint (that red nodes must be "left-leaning") which significantly simplifies the overall implementation. This new algorithm sounded perfect for our purposes, and I spent a few bus rides developing a C# implementation of left-leaning red-black trees based on the published research.

Performance comparison of up to 2000 elements

But wait! Charting needs an ordered multi-dictionary whereas red-black trees implement a standard dictionary - what gives? Well, do you remember the trick I wrote about in my binary tree post where I figured out that I could turn a standard dictionary into an ordered multi-dictionary by adding a value comparison into the mix? Good, because I've done exactly the same thing here. :)

But this time it's even a little bit better! Instead of storing "identical" nodes next "beside" each other (which is not as easy in a red-black tree), I realized that I could collapse all duplicate nodes into the same node by adding a Sibling count to the Node structure. This makes duplicate nodes really easy to deal with because the standard add and remove code stays exactly the same until the very end when it checks for siblings.

But wait - there's more. :) Because it was so easy to implement the ordered multi-dictionary Charting needed, I decided to make my LeftLeaningRedBlackTree implementation both an ordered multi-dictionary and a normal dictionary! You can choose which one you want by passing in either key+value comparison functions to the constructor (to create an ordered multi-dictionary) or just a key comparison function (to create a standard dictionary). All the class's properties and methods work exactly the same in both modes, so switching between them is easy! (To make it even easier, I've added two trivial helper methods to simplify the standard dictionary scenarios: Remove(key) and GetValueForKey(key).)

Performance

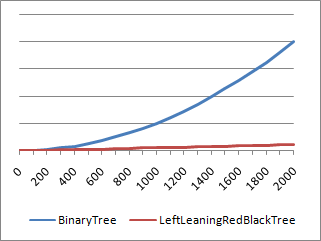
Okay, so this is all well and good, but the real question is whether LeftLeaningRedBlackTree runs faster than BinaryTree or not. Well, if you looked at the graph above comparing the elapsed time (vertical axis) of the two solutions for different node counts (horizontal axis), then you already know the answer. LeftLeaningRedBlackTree is a clear win for the tested scenario (which was sequential adds, a bunch of min/max search operations, then sequential removes - typical Charting behavior). Okay, so once you've decided that LeftLeaningRedBlackTree is a win when node counts start getting large, the next question is how the two implementations compare for low node counts. Because the scale of the previous graph is large and could be obscuring some detail in the low range, let's specifically measure the performance for small numbers of nodes:

Performance comparison focus on less than 100 elements

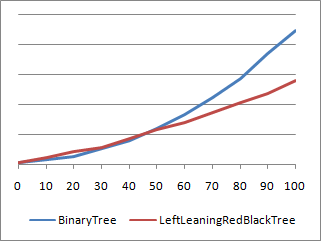
And there you have it: BinaryTree beats LeftLeaningRedBlackTree when the node count is close to 20. Which isn't very surprising when you think about it - for small numbers of nodes, the unbalance of BinaryTree is not yet significant enough to outweigh the overhead that LeftLeaningRedBlackTree incurs from its balancing process. But does this particular region of performance inversion really matter? Not so much - the range where BinaryTree wins is very small, the difference in timings is small, and the impact of sorting on performance at those node counts is basically insignificant. So the next version of Charting doesn't bother trying to pick the best sorting algorithm for different scenarios - it uses LeftLeaningRedBlackTree for everything. And you'll be glad it does when your node count starts growing! :)

Aside: There is a scenario where BinaryTree beats LeftLeaningRedBlackTree even at large node counts. Specifically, if the original data is already completely random, then BinaryTree naturally ends up nicely balanced as a direct consequence of that randomness - and it didn't need to spend any cycles making itself that way! LeftLeaningRedBlackTree doesn't know the data is random and spends cycles balancing itself unnecessarily. However, this performance delta between the algorithms doesn't diverge like in the charts above - LeftLeaningRedBlackTree has a consistent ~35% overhead across the board. It's been said that you never get something for nothing - and this overhead is just part of the cost of having guaranteed balancing behavior across all inputs.

Testing

Okay, so it's faster - but is it correct? Yes, I'm prepared to suggest that it is - and I happen to have a set of automated test cases to back my claim up! :) The tests I've written pick a random number of elements across randomly sized key and value spaces, add all these random pairs to the tree, make sure everything's behaving correctly, and then remove them all in random order. After each add or remove, the complete state of the entire tree is checked against a separate algorithm. And all the while LeftLeaningRedBlackTree is running its own internal code to ensure the invariants of a left-leaning red-black tree are maintained at all times.

I call this whole thing a "scenario". I've found that 100% code coverage is achieved after running just 1 or 2 scenarios; 40 scenarios is all it takes to exercise the set of problematic corner cases I've seen. Well, the automated tests run 1000 scenarios - 250 known scenarios against a normal dictionary, 250 known scenarios against an ordered multi-dictionary, 250 random ones on a normal dictionary, and 250 random ones on an ordered multi-dictionary. Whew!

Of course, no code is ever perfect - but I'm pretty happy with the level of coverage here and optimistic that it's helped squash the bugs that matter.

API

You might expect LeftLeaningRedBlackTree to implement IDictionary<TKey, TValue> - but it doesn't. However, it does have an API that strongly resembles that interface, so it should look pretty familiar. For example, Add looks exactly the same and the single-parameter form of Remove (for normal dictionary mode) is exactly the same as well. Ordered multi-dictionary mode necessitates a two-parameter form of Remove, but it's just what you'd expect. Clear and Count (via IDictionary's base class ICollection<T>) are identical as well.

However, things start to diverge a bit after that. Instead of ICollection<T> properties for Keys and Values (which may be unnecessarily costly to compute if the caller only needed a few of the elements), there are IEnumerable<T> methods GetKeys and GetValuesForAllKeys. It's the same idea, but more efficient thanks to being sequence-based! The array accessor (this[T]) is deliberately absent because it doesn't make much sense for the ordered multi-dictionary mode - I'd rather things be more explicit via Add or GetValueForKey/GetValuesForKey. The latter of those last two methods works in both modes; the first is available as a simplification for normal dictionary mode (and throws KeyNotFoundException for consistency with IDictionary implementations). ContainsKey and TryGetValue are both absent - and trivial to add if you want them. As for the rest of the IDictionary<T>/ICollection<T>/IEnumerable<T>/IEnumerable properties and methods, they either don't make sense on an ordered multi-dictionary or are easy enough to add. And finally, the API is rounded out by the MinimumKey and MaximumKey properties - specifically implemented for efficiency because Charting makes such heavy use of them.

In case that was all just a confusing jumble of class names and interfaces, here's what it looks like in code:

/// <summary>
/// Implements a left-leaning red-black tree.
/// </summary>
/// <remarks>
/// Based on the research paper "Left-leaning Red-Black Trees"
/// by Robert Sedgewick. More information available at:
/// http://www.cs.princeton.edu/~rs/talks/LLRB/RedBlack.pdf
/// http://www.cs.princeton.edu/~rs/talks/LLRB/08Penn.pdf
/// </remarks>
/// <typeparam name="TKey">Type of keys.</typeparam>
/// <typeparam name="TValue">Type of values.</typeparam>
public class LeftLeaningRedBlackTree<TKey, TValue>
{
    /// <summary>
    /// Initializes a new instance of the LeftLeaningRedBlackTree class implementing a normal dictionary.
    /// </summary>
    /// <param name="keyComparison">The key comparison function.</param>
    public LeftLeaningRedBlackTree(Comparison<TKey> keyComparison)

    /// <summary>
    /// Initializes a new instance of the LeftLeaningRedBlackTree class implementing an ordered multi-dictionary.
    /// </summary>
    /// <param name="keyComparison">The key comparison function.</param>
    /// <param name="valueComparison">The value comparison function.</param>
    public LeftLeaningRedBlackTree(Comparison<TKey> keyComparison, Comparison<TValue> valueComparison)

    /// <summary>
    /// Adds a key/value pair to the tree.
    /// </summary>
    /// <param name="key">Key to add.</param>
    /// <param name="value">Value to add.</param>
    public void Add(TKey key, TValue value)

    /// <summary>
    /// Removes a key (and its associated value) from a normal (non-multi) dictionary.
    /// </summary>
    /// <param name="key">Key to remove.</param>
    /// <returns>True if key present and removed.</returns>
    public bool Remove(TKey key)

    /// <summary>
    /// Removes a key/value pair from the tree.
    /// </summary>
    /// <param name="key">Key to remove.</param>
    /// <param name="value">Value to remove.</param>
    /// <returns>True if key/value present and removed.</returns>
    public bool Remove(TKey key, TValue value)

    /// <summary>
    /// Removes all nodes in the tree.
    /// </summary>
    public void Clear()

    /// <summary>
    /// Gets a sorted list of keys in the tree.
    /// </summary>
    /// <returns>Sorted list of keys.</returns>
    public IEnumerable<TKey> GetKeys()

    /// <summary>
    /// Gets the value associated with the specified key in a normal (non-multi) dictionary.
    /// </summary>
    /// <param name="key">Specified key.</param>
    /// <returns>Value associated with the specified key.</returns>
    public TValue GetValueForKey(TKey key)

    /// <summary>
    /// Gets a sequence of the values associated with the specified key.
    /// </summary>
    /// <param name="key">Specified key.</param>
    /// <returns>Sequence of values.</returns>
    public IEnumerable<TValue> GetValuesForKey(TKey key)

    /// <summary>
    /// Gets a sequence of all the values in the tree.
    /// </summary>
    /// <returns>Sequence of all values.</returns>
    public IEnumerable<TValue> GetValuesForAllKeys()

    /// <summary>
    /// Gets the count of key/value pairs in the tree.
    /// </summary>
    public int Count

    /// <summary>
    /// Gets the minimum key in the tree.
    /// </summary>
    public TKey MinimumKey

    /// <summary>
    /// Gets the maximum key in the tree.
    /// </summary>
    public TKey MaximumKey
}

Debugging

At this point, I'm reasonably confident that LeftLeaningRedBlackTree behaves correctly - but that wasn't always the case! :) Three particular debugging aids served me well and I'd like to call them out (Note: to enable the bottom two debugging aids, you need to uncomment the line #define DEBUGGING at the top of LeftLeaningRedBlackTree.cs):

  • The first is a standard .NET technique, but one many people don't seem to be familiar with: DebuggerDisplayAttribute. Specifically, this attribute improves the debugging experience by turning the visual representation of a node from {LeftLeaningRedBlackTree<int,int>.Node} into Key=4, Value=15, Siblings=0. Granted, it's the same information you'd get by expanding to display the node's properties, but it's automatically used in the Autos and Watch windows as well as by tooltips! What's more, this is easy to enable for any class - just provide a customized format string like this: "Key={Key}, Value={Value}, Siblings={Siblings}".
  • Both LeftLeaningRedBlackTree and its private Node class expose a string property that returns an HTML representation of the tree/node and its children. Here's what it looks like when viewed with Visual Studio's built-in "HTML Visualizer" for strings:

    HTML debugging display

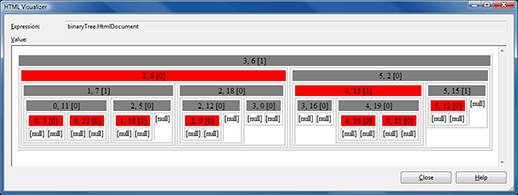
    More than just a cool trick, the HtmlDocument and HtmlFragment properties are an invaluable resource for visualizing the many rotations/manipulations of the tree as it balances itself. After you've stared at this kind of stuff for a while, you start to develop a sense of what looks wrong - and this visualization makes finding algorithmic problems quite a bit easier than if the in-memory representation of the tree was all you had!

  • When enabled for debugging, the AssertInvariants method gets called at the end of every method that manipulates the tree. The purpose of this method is to ensure the basic requirements of a left-leaning red-black tree are maintained - specifically, it Asserts that the following conditions are true every time it's called:
    • Root node is black
    • Every path from the root to leaf nodes contains the same number of black nodes
    • Left node is less
    • Right node is greater
    • Both children of a red node are black
    • Nodes are always left-leaning
    • No consecutive red nodes

Summary

LeftLeaningRedBlackTree has been a fun project and I'm glad to be able to leverage it to help make significant improvements to Charting's performance for some very real customer scenarios. I'd like to extend my thanks to Dr. Sedgewick for his research in this area and express my hope that others will be able to take advantage of LeftLeaningRedBlackTree to improve the performance of their own applications. As always, if you run into any problems, please let me know - any errors here are my fault, not anyone else's! :)


[Please click here to download the source code for LeftLeaningRedBlackTree, its test application, unit tests, and the comparison project.]