Silverlight Charting remains just a click away - and runs on WPF, too!! [ChartBuilder sample and source code updated for Charting's March 09 release]
In yesterday's announcement of the March 09 release of the Silverlight Toolkit and Silverlight Charting, I gave an overview of some new Charting features. One of the things I always do right after we release a new version of Charting is update my ChartBuilder sample/application/learning tool. If you're not already familiar with ChartBuilder, here's some background reading: Introduction/user's guide for November 08 release, Fix for non-US cultures, Update for December 08 release.
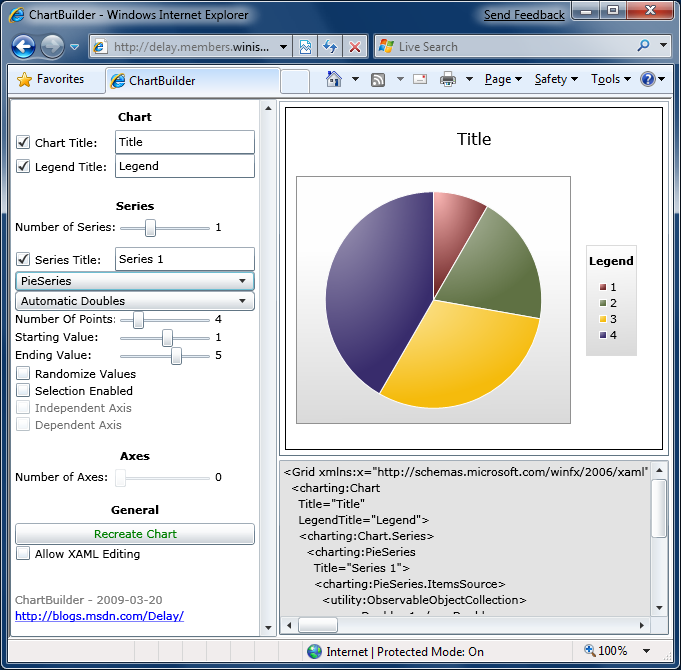
This time around is no different and I've just updated the live ChartBuilder application! It's a typical Silverlight 2 application, so you can run it with Silverlight 2 OR the newly released Silverlight 3 Beta.
Please click this text or the image below to run the latest ChartBuilder in your browser.

You can click here to download the complete ChartBuilder source code.
Release notes:
- Added support for new series type AreaSeries.
- Slightly better round-tripping behavior for
doubles andDateTimes from the helper classPair. - Various other minor improvements.
- Updated the version to 2009-03-20.
Although we have - literally - thousands of automated test cases for Charting, ChartBuilder remains our de facto testing tool and has helped us to prevent or debug countless issues during the months we've been developing the Charting framework. I use it regularly to investigate strange behavior or to provide the scaffolding for one-off test cases that would otherwise require quite a bit of time and effort to create.
ChartBuilder won't win any awards for great user interface design, but it has been worth its weight in gold to us. I hope it helps you, too!
Oh, and one more thing... :)
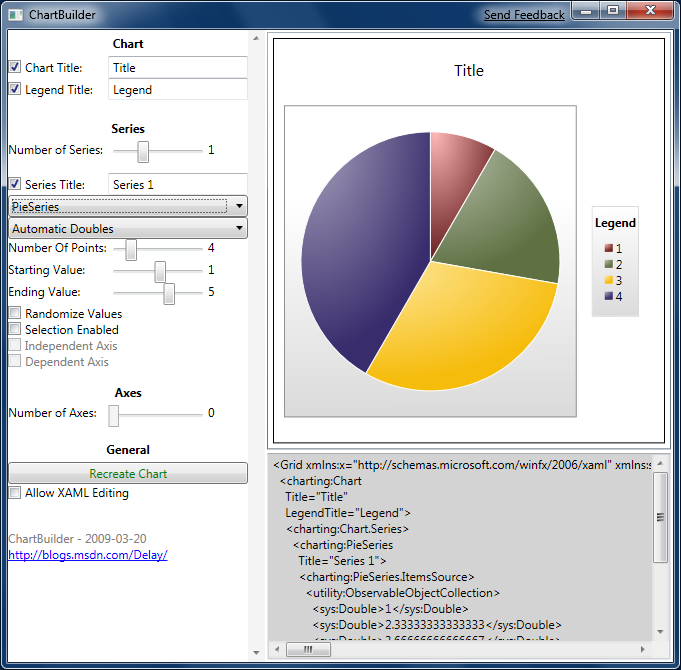
It's always been our goal with Charting to support both Silverlight and WPF - and we've been compiling Charting for the WPF platform as part of our daily builds for the past few months. I thought it would be neat to show off a sneak preview of WPF Charting here, so I created a WPF build of ChartBuilder and hooked it up to the WPF build of Charting and - yup - it just worked. Well, mostly... :)
Warning: We have done absolutely no testing of the WPF Charting bits and if you decide to pull them out of the source code download and play around with them, then you do so at your own risk!
The great thing about what's going on here is that Silverlight Charting and WPF Charting are both compiled from exactly the same source code and XAML and allow you to use exactly the same source code and XAML in your projects. So you'll be able to create a chart on one platform and share it seamlessly with the other platform and you won't have to do any extra work! To help prove my point, ChartBuilder itself is built from exactly the same source code and XAML for both Silverlight and WPF!

The most obvious problem I've seen from playing around with WPF ChartBuilder for a little is that sometimes dynamically added/removed DataPoints don't play their reveal/show/hide transition properly. Some of the points coming in are obviously present in the chart because there's space reserved for them and their tooltips work properly - but they're not visible. And some of the points going out just don't go away like they're supposed to. My primary suspect here is VSM (the Visual State Manager; a Silverlight concept that's been ported to WPF); WPF Charting uses the WPF Toolkit's preview implementation of VSM and there may be some incompatibilities between that implementation and the one in Silverlight. Charting on WPF also has a few fit-and-finish issues; these are probably easy to fix, but like I said we haven't spent any time working on Charting for WPF.
Important: If you do decide to try WPF Charting, please note that it's necessary to add references to both the DataVisualization assembly and the WPFToolkit assembly or else you'll get a weird error from WPF when we attempt to use VSM and its implementation isn't present.
Okay, that's all I've got for now. :) I hope you have fun with Charting - on whatever platform you choose!