Pineapple upside-down chart [How to: Invert the axis of a chart for "smaller is better" scenarios]
Let's imagine that we want to use Silverlight (or WPF!) to chart the performance of a book on one of those "bestsellers" lists... The book we care about has been doing very well lately; here's the corresponding data we want to display:
var items = new List<DataItem>
{
    new DataItem(new DateTime(2009, 4, 1), 10),
    new DataItem(new DateTime(2009, 4, 8),  5),
    new DataItem(new DateTime(2009, 4, 15), 2),
    new DataItem(new DateTime(2009, 4, 22), 1),
    new DataItem(new DateTime(2009, 4, 29), 1),
};
Naturally, we'll use the Charting controls that are part of the Silverlight Toolkit (and also available for WPF). :) Charting is easy to use and we quickly bang out the following XAML to create something suitable:
<charting:Chart
    FontSize="9">
    <charting:LineSeries
        ItemsSource="{Binding}"
        DependentValuePath="Place"
        IndependentValuePath="Date"
        Title="Book">
        <charting:LineSeries.DataPointStyle>
            <Style TargetType="charting:LineDataPoint">
                <Setter Property="Background" Value="Maroon"/>
            </Style>
        </charting:LineSeries.DataPointStyle>
        <charting:LineSeries.DependentRangeAxis>
            <charting:LinearAxis
                Orientation="Y"
                Minimum="0.5"
                Maximum="10.5"
                Interval="1"
                ShowGridLines="True"/>
        </charting:LineSeries.DependentRangeAxis>
    </charting:LineSeries>
</charting:Chart>
It looks like this:
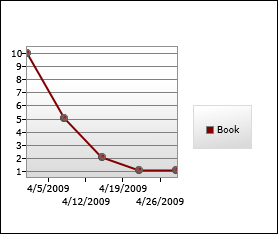
Hurm...
The chart is 100% correct, but there's a problem: it looks like the book is becoming less popular, not more popular. Most of us are used to assuming that "bigger/taller is better", but that's not the case for the data in this scenario and so the chart's meaning is not intuitively obvious. In the ideal world, there would be a bool Invert property on LinearAxis that you could toggle to "flip" the vertical axis and save the day. Unfortunately, we haven't yet implemented such a property (though it's on our list of things to do)...
Therefore, it looks like a clever solution is called for - and in this case the simple trick is to invert the values before charting them. After inversion, the "best" values (low numbers like 1) will be numerically greater than the "worst" values (high numbers like 10) and will therefore appear towards the top of the chart. This seems almost too easy, so let's see how it works out in practice by writing a simple IValueConverter to invert the values and then making the highlighted changes to the XAML:
public class InverterConverter : IValueConverter
{
    public object Convert(object value, Type targetType, object parameter, CultureInfo culture)
    {
        if (value is int)
        {
            return -(int)value;
        }
        throw new NotImplementedException();
    }

    public object ConvertBack(object value, Type targetType, object parameter, CultureInfo culture)
    {
        throw new NotImplementedException();
    }
}
<charting:Chart
    FontSize="9">
    <charting:LineSeries
        ItemsSource="{Binding}"
        DependentValueBinding="{Binding Place, Converter={StaticResource InverterConverter}}"
        IndependentValuePath="Date"
        Title="Book">
        <charting:LineSeries.DataPointStyle>
            <Style TargetType="charting:LineDataPoint">
                <Setter Property="Background" Value="Maroon"/>
            </Style>
        </charting:LineSeries.DataPointStyle>
        <charting:LineSeries.DependentRangeAxis>
            <charting:LinearAxis
                Orientation="Y"
                Minimum="-10.5"
                Maximum="-0.5"
                Interval="1"
                ShowGridLines="True"/>
        </charting:LineSeries.DependentRangeAxis>
    </charting:LineSeries>
</charting:Chart>
The resulting chart:
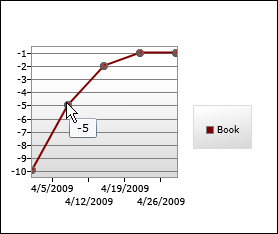
Woot - the chart now clearly communicates the book's recent popularity! But the trick we played with negative numbers is plainly visible for everyone to see and they will probably mock us mercilessly. :( If only there were some way to customize the chart's visuals to hide what we've done and complete the illusion...
Wait - there is a way! All we need to do is take advantage of Charting's DataPoint.DependentValueStringFormat and LinearAxis.AxisLabelStyle properties and mix in a little of .NET's support for "Section Separators and Conditional Formatting".
[Type, type, type...]
<charting:Chart
    FontSize="9">
    <charting:LineSeries
        ItemsSource="{Binding}"
        DependentValueBinding="{Binding Place, Converter={StaticResource InverterConverter}}"
        IndependentValuePath="Date"
        Title="Book">
        <charting:LineSeries.DataPointStyle>
            <Style TargetType="charting:LineDataPoint">
                <Setter Property="Background" Value="Maroon"/>
                <Setter Property="DependentValueStringFormat" Value="{}{0:0.#;0.#}"/>
            </Style>
        </charting:LineSeries.DataPointStyle>
        <charting:LineSeries.DependentRangeAxis>
            <charting:LinearAxis
                Orientation="Y"
                Minimum="-10.5"
                Maximum="-0.5"
                Interval="1"
                ShowGridLines="True">
                <charting:LinearAxis.AxisLabelStyle>
                    <Style TargetType="charting:AxisLabel">
                        <Setter Property="StringFormat" Value="{}{0:0.#;0.#}"/>
                    </Style>
                </charting:LinearAxis.AxisLabelStyle>
            </charting:LinearAxis>
        </charting:LineSeries.DependentRangeAxis>
    </charting:LineSeries>
</charting:Chart>
Presto:
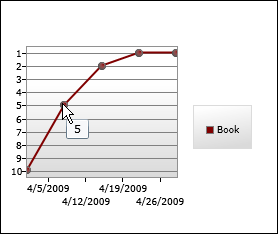
Success - our chart looks exactly how we want it to and we barely even broke a sweat! You can go ahead and pat yourself on the back a few times - then stop spending time imagining Charting scenarios and get back to work! :)