No trees were harmed in the making of this blog post [How to: Successfully print a Chart with the Silverlight 4 Beta]
One of the big requests people have had for Silverlight was the ability to print, so one thing that's new in the Silverlight 4 Beta is the PrintDocument class which enables applications to print anything they want! There isn't an excess of fancy bells and whistles quite yet, but the support Silverlight provides is enough to do just about everything - it's just that sometimes you might need to do a little more than you expect.
Okay, so that's all well and good and people can print any content they want and it all looks beautiful and works perfectly, right? Pretty much, yes! Well, except for certain scenarios involving charts from the Silverlight/WPF Data Visualization assembly. Chart that's already in the visual tree, it works just fine and what you see really is what you get. But if you've tried to create custom content specifically for printing (for example: a different layout, maybe some page headers and footers, etc.) and that content included a Chart instance, you probably noticed a minor issue: none of the data points showed up on the page. Darn, it sure is hard to tell what's going on without those data points...
Fortunately, a bit of mental debugging reveals what's going on here. Charting's data points fade in by default - from Opacity 0 to 1 over the course of 0.5 seconds via a Visual State Manager transition. That's cool and it works great in the visual tree - however, when you're creating print-specific visuals and immediately printing them, those data points don't have a chance to do much fading in... So they're actually all there on the printed page, but they're at Opacity 0, so you can't see them!
What to do? Well, the most convenient thing would be for the Chart code to somehow know it was going to be printed and SkipToFill those pesky animations. But there's no official way for a control to know it's being created for printing. There are a few tricks the Chart could use to make an educated guess, but it doesn't do so yet - and I'm not sure that's the right answer anyway. So the next most obvious thing would be to re-Template the DataPoints to replace the default fading Template with one that doesn't fade, but instead starts fully visible. And as you'd expect, this works just fine - the data points show up and look great!
However, that's a lot of work that you probably don't want to have to do. It would be nice if there were a middle ground - some technique that was maybe a little bit of a hack, but that was really easy to implement and worked just about all the time...
And the good news is that there is such a hack! The idea builds upon the observation that printing a Chart from the visual tree works correctly - so let's start by popping our new, print-ready chart into the visual tree to give it a chance to get all pretty, then print it once that's done. That seems easy enough, let's try it:
// Create customized content for printing
var chart = new Chart { Title = "My Printed Chart" };
var series = new LineSeries
{
    ItemsSource = (PointCollection)Resources["Items"],
    DependentValuePath = "Y",
    IndependentValuePath = "X",
};
chart.Series.Add(series);
var content = new Border
{
    BorderBrush = new SolidColorBrush(Colors.Magenta),
    BorderThickness = new Thickness(10),
    Child = chart,
};

// Create container for putting content in the visual tree invisibly
var visualTreeContainer = new Grid
{
    Width = 1000,
    Height = 1000,
    Opacity = 0,
};

// Put content in the visual tree to initialize
visualTreeContainer.Children.Add(content);
LayoutRoot.Children.Add(visualTreeContainer);

// Prepare to print
var printDocument = new PrintDocument();
printDocument.PrintPage += delegate(object obj, PrintPageEventArgs args)
{
    // Unparent the content for adding to PageVisual
    visualTreeContainer.Children.Remove(content);
    args.PageVisual = content;
};

// Print the content
printDocument.Print();

// Remove container from the visual tree
LayoutRoot.Children.Remove(visualTreeContainer);
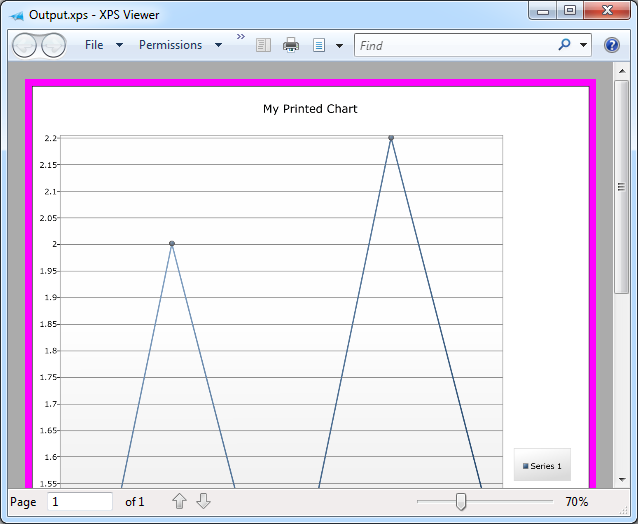
Note that the sample application is creating a completely new Chart instance here (with a print-specific title and custom magenta frame) - and that the printed output looks just like it should:

The Chart is added to the visual tree before the print dialog is shown - so it has plenty of time for those 0.5 second animations to play to completion while the user interacts with the dialog. The only sketchy bit is that an exceedingly fast user could possibly manage to print a Chart before the animations had run all the way to completion. Yes, well, I said it was a hack up front, didn't I?
PS - The XPS Printer driver is a fantastic tool for testing printing scenarios like this one. By printing to a file and opening that file in the XPS Viewer application that comes with Windows, I was able to avoid wasting a single sheet of paper during the course of this investigation. Highly recommended!