The blog of dlaa.me

Having problems with layout? Switch to Plan B! [LayoutTransformControl scenarios for WPF]

When I first wrote about adding full LayoutTransform fidelity to Silverlight with my LayoutTransformControl project, I mentioned that I'd found two scenarios where LayoutTransformControl's behavior differed from WPF's LayoutTransform. (Background reading for LayoutTransformControl: Motivation and introduction for Beta 1, Significant enhancements and update for Beta 2, Update for RTW, Fixes for two edge case bugs) These two differences were intentional because it seemed to me that the corresponding WPF behavior was incorrect. Now you can judge for yourself. :)

The sample WPF application shown here (note: complete source code is attached to this post) demonstrates two variants of the problematic scenarios; one rendered by WPF's LayoutTransform and the other by LayoutTransformControl. The top four cells demonstrate the first scenario and the bottom four cells demonstrate the second. Cells on the left show a variant that both implementations agree on while cells on the right show a small modification that demonstrates conflicting behavior. I've shaded the problematic sections red to help identify them. Here's how it looks:

WPF LayoutTransform issue demonstration

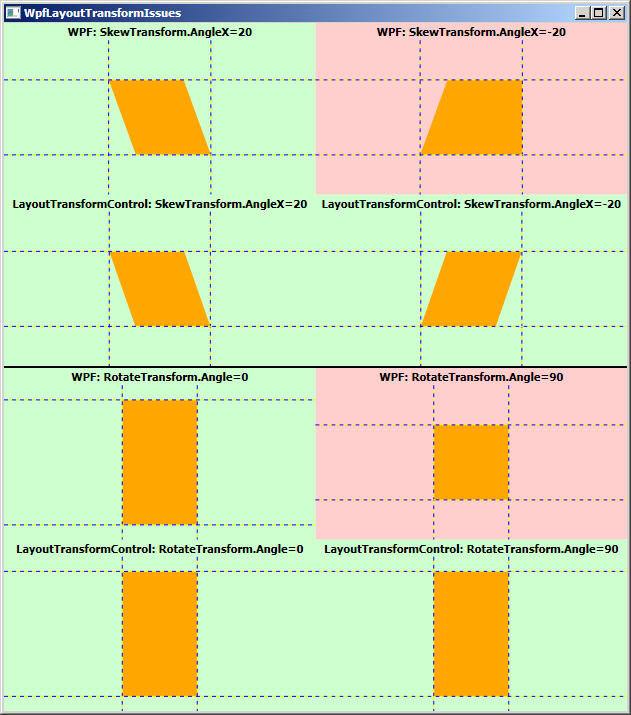
The XAML for top scenario's red quadrant is this:

<Grid Background="Orange">
    <Grid.LayoutTransform>
        <SkewTransform AngleX="-20"/>
    </Grid.LayoutTransform>
    <Grid MinHeight="75" MinWidth="75"/>
</Grid>

It's a simple skew on a free-sized Grid with arbitrary content (for simplicity, the content is another Grid with MinWidth/MinHeight, but this could be a Button or any other typical content). The behavior for positive skew angles makes sense to me, but the behavior for negative angles seems inconsistent and causes undesirable clipping of the content (which is really obvious when applied to a Button). The corresponding XAML for LayoutTransformControl's "correct" rendering is:

<l:LayoutTransformControl>
    <l:LayoutTransformControl.Transform>
        <SkewTransform AngleX="-20"/>
    </l:LayoutTransformControl.Transform>
    <Grid Background="Orange">
        <Grid MinHeight="75" MinWidth="75"/>
    </Grid>
</l:LayoutTransformControl>

The XAML for bottom scenario's red quadrant is this:

<Grid Width="75">
    <Grid Background="Orange">
        <Grid.LayoutTransform>
            <RotateTransform Angle="90"/>
        </Grid.LayoutTransform>
        <Grid MinHeight="125" MinWidth="125"/>
    </Grid>
</Grid>

It's a width-constrained, free-sized Grid with arbitrary content. The behavior for Angle=0 (or 180) makes sense to me, but the behavior for Angle=90 (or 270) does not; at this angle the content should be vertically unbounded and should stretch to the full 125 pixels of the inner Grid. Changing the nature of the outer constraint from width to height exhibits the same "doesn't stretch" behavior at Angle=90 (or 270). The corresponding XAML for LayoutTransformControl's "correct" rendering is:

<Grid Width="75">
    <l:LayoutTransformControl>
        <l:LayoutTransformControl.Transform>
            <RotateTransform Angle="90"/>
        </l:LayoutTransformControl.Transform>
        <Grid Background="Orange">
            <Grid MinHeight="125" MinWidth="125"/>
        </Grid>
    </l:LayoutTransformControl>
</Grid>

I reported both of these issues to the WPF team when I found them, but unfortunately they weren't able to address them for the .NET 3.5 SP1 release. Although it might put LayoutTransformControl out of a job, I'm optimistic that both will be fixed in a future update of WPF. :) For the time being, though, I humbly suggest giving LayoutTransformControl a try if you encounter unexpected behavior like this. It's probably the quickest, easiest patch you'll find!

[WpfLayoutTransformIssues.zip]

An unexceptional layout improvement [Two LayoutTransformControl fixes for Silverlight 2!]

I'd almost finished patting myself on the back for managing to implement WPF's LayoutTransform on Silverlight using just the RenderTransform available on that platform. (Background reading for LayoutTransformControl: Motivation and introduction for Beta 1, Significant enhancements and update for Beta 2, Update for RTW) Yes, everything was peachy - until I was contacted by kind reader Matthew Serbinski with a report of an InvalidOperationException being thrown by Silverlight when using LayoutTransformControl with a ScaleTransform with ScaleY=0... :(

You've probably already recognized ScaleY=0 as something of an edge case for layout: a value which collapses everything into nothingness. I looked into how WPF's LayoutTransform code handled this situation and discovered that it specifically detected circumstances corresponding to a transformation matrix without an inverse - and skipped performing the usual layout computations. My LayoutTransformControl implementation didn't look for this special case, ended up violating one of the rules of the layout system, and triggered the reported exception.

So I added a little bit of code to handle such input the same way WPF does. And while I was at it, I checked to see if maybe there were other special cases that LayoutTransformControl wasn't handling properly... Sure enough, I found one other scenario: that of needing to layout within an container having no width or height. In this case, LayoutTransformControl's behavior wasn't wrong enough to cause an exception (or any visible problem I noticed), but I made a similar tweak for consistency with WPF.

Changes in place, I modified the LayoutTransformControl sample application, its Silverlight test framework, and its WPF test framework to allow setting both ScaleX and ScaleY to 0. (I'd formerly limited ScaleX/ScaleY to positive values which is why I didn't realize there was a problem myself.) Then I spent some time playing around with the test apps: trying all kinds of things and looking for any other anomalous behavior. Nothing turned up, so I updated the LayoutTransformControl source code download and started writing this post... :)

LayoutTransformControl Sample Application

Changes to code always involve a certain amount of risk that a regression will be introduced. Fortunately, the changes here are small, self-contained, and easy to test - so I'm optimistic they won't cause problems for those of you already using LayoutTransformControl in your projects. Of course, if there are any new problems - or existing ones I don't know about yet! - please let me know and I'll look into them as quickly as I can.

Thank you for your help - happy LayoutTransform-ing!

Shamelessly benefitting from the work of others [Links to Silverlight Airlines and Surface samples for RTW!]

I try to keep up with migrating my various samples to the latest Silverlight Beta/RTW releases, but I don't always have the chance to do so as quickly as I'd like. That's why it was great to find that someone had already done some of the work for me. Two someones, in fact! :)


Silverlight Airlines Demo

The original Silverlight Airlines demo my team did for MIX 07 is available on the Silverlight.net gallery:
[Runnable Sample]
[Source Code]


Silverlight Surface Demo

My popular Silverlight Surface demo has been updated by pureBlue consulting to include video support:
[Runnable Sample]
[Source Code]


To be clear, I wasn't involved with the porting efforts and I haven't reviewed the source code for either sample. However, I bet these are both still great learning resources for new Silverlight developers!

Thank you to everyone out there who's helping to make Silverlight fun and easy to learn.

A fix for simple HTML display in Silverlight [HtmlTextBlock bug fix for Silverlight 2 RTW!]

I updated my HtmlTextBlock sample for RTW last night and got an email from kind reader Ed Silverton this morning pointing out a problem setting FontSize on a standalone instance of the control. (Background reading: HtmlTextBlock Announcement for the Alpha, Improvements, Beta 1 Update, Data Binding Support, Beta 2 Update, RTW Update) Unfortunately, this problem does not demonstrate itself in the sample project, so I missed it. :( Sorry about that!

Ed's scenario was that of setting the FontSize or Foreground properties in the XAML for an instance of HtmlTextBlock; he observed that they did not take effect. What I think happened is that these Silverlight properties became inheritable between Silverlight Beta 2 and RTW, so the code in HtmlTextBlock to set up TemplateBindings to them was interfering with their normal operation. I simply removed the code in HtmlTextBlock that deals with the inheritable properties: FontFamily, FontSize, FontStretch, FontStyle, FontWeight, and Foreground. (Note that TextDecorations doesn't count because it's not present on the Control class HtmlTextBlock derives from.) After that, all was well.

Mostly, that is... Ed's scenario now worked fine and so did the sample page - except for when the font size was changed to a small value. After that, changes to the font or size had no effect. Specifically, this problem seems to occur once the size of the text is small enough that the TextBlock fits completely within the bounds of the HtmlTextBlock. Not completely surprisingly, any changes to the TextBlock.Text property cause it to update itself correctly. I don't have a great deal more time to investigate this at the moment, and it's seeming like it may be an issue with Silverlight's TextBlock (I'll follow up internally), so I worked around the problem in the sample page (note: not the HtmlTextBlock code which I think is correct) by resetting the Text property when the font or size is changed by the user.

HtmlTextBlock Demonstration

I've updated the HtmlTextBlock demonstration page and the source code download, so you can try things out in your browser and/or download the code to see how it works!

Sigh, I knew yesterday's painless migration of this sample went too smoothly to be true... :)

My take on simple HTML display in Silverlight [HtmlTextBlock sample updated for Silverlight 2 RTW!]

A couple of readers have asked about an update to my long-running HtmlTextBlock sample for Silverlight 2 RTW. (Background reading: HtmlTextBlock Announcement for the Alpha, Improvements, Beta 1 Update, Data Binding Support, Beta 2 Update) One person went so far as to migrate it himself after emailing me! :) He said the process went well, and I spent a bit of time on the bus ride home doing the migration myself to understand what was involved.

HtmlTextBlock Demonstration

I've updated the HtmlTextBlock demonstration page and the source code download, so you can try things out in your browser and/or download the code to see how it works!

Notes:

  • The only change to the Beta 2 code was to handle the fact that the type of the object returned by HtmlDocument.GetElementsByTagName is now a base class of the HtmlElement instance the code was expecting. After a simple application of the as operator, the code compiles and works like before!

That's it!

Gee, I wish everything went this smoothly... :)

My new home page [A collection of great Silverlight Charting resources!]

It's been nearly two weeks since the Silverlight Toolkit's November release. I've been trying to keep up with what's been written about Charting and want to summarize some of the most helpful posts I've seen so far.

Overviews (100 level)

Scenarios (200 level)

Internals (300 level)

My own Charting posts (Ego level)

Many, many thanks to everyone who has spent time helping others learn how to use Silverlight Charting!

PS - If I've missed any good resources, please leave a comment and to them - I'm always happy to find good Charting content! :)

Improving ChartBuilder's cultural sensitivity [ChartBuilder app/source updated!]

Kind readers Eugenio and Thimp independently reported that the initial version of ChartBuilder did not work well on machines with certain culture settings. Specifically, ChartBuilder was inadvertently using the CurrentCulture for formatting numbers in XAML and that's a problem because the XAML is parsed according to the InvariantCulture. For example, on German machines ChartBuilder would write a double value to XAML as "1,23" according to the German culture settings - and the XAML parser would complain that wasn't a valid value. I'm usually able to catch problems like this by running code analysis and fixing all the Microsoft.Globalization warnings like CA1305, but in this case the code was calling objectInstance.ToString() which doesn't have any IFormatProvider-based overloads and therefore generates no warnings.

My sincerest apologies to anyone who was affected by this problem. I have switched one of my machines to the German locale and will leave it there for a couple of days as punishment. :)

I made the culture fix on my bus ride this morning and had a bit of extra time, so I also made the following improvements:

  • Added support for the Axis.Interval property. Now it's possible to customize the frequency of the labels, tickmarks, and gridlines on an axis.
  • Added the "datavis" xmlns prefix so it's already present for people who might need to reference it. [Like me when I posted a sample to the forums the other day. :) ]
  • Updated the version to 2008/11/06.

Again, sorry for any trouble. I hope the updated ChartBuilder works well for everyone - and that you enjoy the minor improvements!


You can click this text or the image below to run the latest ChartBuilder in your browser.

ChartBuilder

[And click here to download the complete ChartBuilder source code.]

Easily create an ISO from a CD/DVD [Releasing ExtractISO tool and source]

A few years back I found myself in need of a tool to create an ISO image from a CD I owned. I searched around a bit, but the only tools I could find to do that were part of much larger programs and cost money I didn't want to spend. The concept seemed simple enough that I figured it would be fairly easy to write my own tool to do this. So I did. :)

ExtractISO is a native, console-mode application that does what its name suggests: extracts the contents of a CD or DVD and saves it to a file. The tool and complete source code are attached to this post as ExtractISO.zip. Here's the documentation that comes with it:

====================================
==  ExtractISO                    ==
==  http://blogs.msdn.com/Delay/  ==
====================================


Summary
=======

ExtractISO - Creates an ISO image file from a CD/DVD

ExtractISO reads raw sectors from the specified CD/DVD volume and writes them
to the specified ISO image file.  The resulting file can be burned to a blank
CD/DVD disc, mounted in a virtual CD/DVD drive, or opened in an ISO viewer.

For a discussion of the limitations of this process, please refer to:
   http://www.cdrfaq.org/faq02.html#S2-28

Note that direct access to a CD/DVD volume requires administrative privileges.

ExtractISO attempts to read damaged media by retrying failed reads a few times
before giving up. In the event of a persistent read failure, the partial output
file is not deleted so that subsequent extraction attempts (possibly after
cleaning the media and/or using a different drive to read it) can be attempted
without the loss of any successfully extracted data.

Syntax: ExtractISO D: File.iso
   D: is the CD/DVD drive to extract from
   File.iso is the file to write to


Version History
===============

Version 1.11, 2008-11-04
Improved formatting of "bytes extracted" display value
Initial public release

Version 1.10, 2006-03-12
Added support for damaged media recovery (see above)

Version 1.01, 2005-05-18
Fixed silly integer overflow problem with "bytes extracted" display
Note: Problem affected display only; no functional impact

Version 1.0, 2005-04-27
Initial release

ExtractISO has been available to anyone inside Microsoft since I wrote it. Last week, I got an unexpected request to make it public so certain customers could use it. I was happy to do so, but one thing had been bothering me for a while: the status display of the bytes extracted so far didn't group by thousands. Instead of "1,000,000", the counter displayed as "1000000" which I find more difficult to parse. This was such a small issue, I never got around to fixing it - but now seemed like the ideal time to do so!

Unfortunately, this formatting task which is so simple in .NET seems to be quite a bit more involved with the Win32 API. The first problem is that printf doesn't support outputting the thousands separator. I considered using something like the sample code the previous link suggests, but wanted something simpler and easier to understand. A bit of research turned up the GetNumberFormat API which seemed like the perfect solution. However, the GetNumberFormat API suffers from at least two notable shortcomings: it's not easy to customize the output and the input needs to be a string. I did a quick test and found that the output of GetNumberFormat for "1000000" is "1,000,000.00" (on my machine using the default United States settings). This is close to what I wanted, but displaying the integral byte count with two digits of decimal precision just seems silly to me. So I looked for an easy way to customize the output via NUMBERFMT, and ran into the same issues Michael talks about in the post I linked to. When further research turned up no better alternatives, I decided to use GetNumberFormat and then "fix" its output by calling GetLocaleInfo(LOCALE_SDECIMAL) and removing everything after the localized decimal character(s). I like this approach because it is almost all platform code (i.e., code I don't have to write/test) and should be correct for all cultures where numbers are written as "1,000,000.00", "1.000.000,00", etc..

Other than the formatting issue I've just discussed, I made no other changes to the ExtractISO implementation. The only things I did were to update some of the VERSIONINFO settings, tweak the Build.cmd script, and recompile with the latest Visual Studio 2008.

ExtractISO works reasonably quickly, but it's worth mentioning that performance was specifically not a goal when I wrote it. The code implements a simple read/write loop with a 1 MB buffer and makes no attempt to interleave the two operations. The large-ish buffer should help minimize the overhead of the read/write calls, but I suspect a different implementation that issues the reads and writes in parallel would be faster. However, achieving that parallelism comes at the price of complexity - and I didn't feel the time it would have taken to write and debug that code was justified here. Even at top speed, the extraction operation is going to take a minute or two - an extra minute on top of that seems a small price to pay for simpler, easier to maintain code. You are welcome to disagree, of course. :) If you develop a faster implementation, I'd love to hear about it!

ExtractISO is a simple tool with a simple purpose - and one that I've used quite happily for a number of years now. If you've got a hankering for ISOs and like free stuff, please have a look at ExtractISO!

PS - ExtractISO cannot be used to duplicate audio CDs or copy-protected DVDs: audio CDs use a different storage scheme than data CDs and copy-protected DVDs store their encryption key in an "inaccessible" location of the disk.

[ExtractISO.zip]

Smaller is still better! [A simple step continues to shrink the download size of Silverlight 2 applications]

A few months ago, I looked at the size of Silverlight 2 XAP files and blogged a simple way to reduce the size of typical XAP files by about 22%. Silverlight 2 was still under development at the time and a lot of work has gone on since then (including the official release of Silverlight 2!). I wanted to revisit this topic to see if my XapReZip script was still worth running, or if it had been rendered useless by better default compression behavior for the Silverlight Tools package. I just ran XapReZip against three of the same scenarios as last time - here's the new data for sizes of the resulting XAP files:

Scenario Starting Size After XapReZip Difference Reduction
New Silverlight Project 4,365 3,491 874 20%
... with DatePicker 88,047 68,760 19,287 22%
... and DataGrid 216,368 170,217 46,151 21%

The results are nearly identical to what they were back in July when I first blogged about XapReZip, so the issue of sub-optimal default compression still seems to be with us. :( But the good news is that my original XapReZip script works just as well today as it did before! :) And even better news is that other folks have taken things a step further and written tools to make this even easier. Here's a post by Rob Houweling where he shares his ReXapper tool (a compiled, self-contained version of the same process). And here's a post I've just found by Valeri Hristov that uses 7-Zip - and appears to pre-date my original XapReZip post!

Keeping download size small helps get content to your users as quickly as possible - and satisfying users is always important! Please consider adding a re-compression step to your Silverlight 2 project today; your users - and download costs - will thank you. :)

Click your way to great Silverlight charts [Live ChartBuilder sample and source code!]

Yesterday in my Introduction to Charting with the Silverlight Toolkit post, I included a teaser for my ChartBuilder application. The tease ends today, because I've just posted a live ChartBuilder for everyone to play with and am also making the source code available for download.

What is ChartBuilder?

In addition to driving the Silverlight Charting effort and being one of the primary developers, I was also the entire test team for Charting. (I told you we were resource constrained.) I decided pretty quickly that I needed to do what I could to make it easy for anyone to exercise the Charting implementation, find bugs, and report them. Additionally, I wanted an easy way for the developers to exercise what they'd written in strange and unusual ways. My task was somewhat complicated by the fact that Charting supports fully dynamic data sources - static XAML Charts simply aren't enough to cover all the scenarios we care about.

I tried to capture a hint of this dynamic behavior in the samples project (I wrote all the samples, too - except for the two fantastic Scenarios which were contributed by Ted Glaza (Custom Series) and Ruurd Boeke (Series Zoom)). But the sample project isn't the most debugging-friendly environment because of all the different Chart instances it loads. Last - but certainly not least - I knew there would be a lot of customers looking at Charting with very little idea how our API and object model work.

I had a vision for an interactive chart-building application that would expose the most common Charting concepts with some simple UI, show how those settings combined to create a chart, AND show the corresponding XAML code to build that chart. What's more, I wanted changes to the chart's settings to be made in real-time to the running instance of the chart so that users could see how the dynamic data support actually works. (And so developers could fix it when it didn't!) And because it was so easy, I enabled a live XAML editing experience (think XAMLPad) for folks who demand absolute control over their charts. :)

What does it look like? How do I play with it?

Below is a static image of ChartBuilder as it existed yesterday to give an idea of what I'm talking about.

Better yet, you can click this text or the image below to run the latest ChartBuilder in your browser!

ChartBuilder

[Click here to download the complete ChartBuilder source code.]

The left side of the application is where you go to customize your chart, the upper-right side of the application shows the current chart, and the lower-right side shows the complete XAML for that chart (wrapped in a Grid to keep the XAML clean).

Changes you make to the settings are automatically applied to the running instance of the chart as well as the XAML for that chart - so if you're curious how the API and object model look, just set things up how you want them and look at the XAML! As a convenience, the XAML area supports copying to the clipboard (use Ctrl+C or whatever your platform's standard "copy" keystroke is). That means you can build a chart you like and then paste the XAML right into your own source code to help get started.

If you ever do something that's not allowed - or hit a bug - and an exception is thrown, the complete exception details will appear in a red text box over the chart - which can also be copied to the clipboard. ChartBuilder will let you continue to change the settings and keep going after an exception, but please bear in mind that some exceptions may leave the chart with inconsistent internal state. At any time you can hit the green "Recreate Chart" button to completely recreate the chart instance from the current settings and get everything back in sync.

Anything else I should know?

  • ChartBuilder is a dual-edged sword: the same power that lets you explore strange and creative new scenarios also lets you do things that are not supported. We've tried to throw informative exceptions whenever we detect something unusual, so please read the exception message for details about what went wrong.
  • Of course, if an exception message makes no sense, or a broken scenario seems like it should be supported, or things just seem to be flat-out wrong, please post a question in the Silverlight Controls forum or report a bug with the Silverlight Toolkit Issue Tracker. When reporting issues, please include as much detail as possible; ChartBuilder makes that easy by letting you copy the entire exception text. What's more, if you can reproduce the problem reliably, then you can report it by giving us a simple list of steps to follow in ChartBuilder! Problems that are demonstrated by ChartBuilder scenarios are usually a pleasure to debug because it's so easy to tell what's going on and so easy to isolate the problematic behavior. [Well, most of the time! :) ]
  • One thing I did not do with ChartBuilder is spend a lot of time designing or implementing a comprehensive architecture for the application. More often than not, the little bits of time I found for adding features were spent in a frenzy of coding with me trying to enable new testing scenario as quickly as possible. When forced to choose between refactoring and getting a new feature implemented, the new feature always won. I've made a quick pass over the code since PDC and it's not as bad as I feared - but I guarantee it won't be winning any beauty contests. :)
  • Because ChartBuilder was written to validate the functionality of Charting, it would be ideal if ChartBuilder itself were bug-free. While I've done what I can to try to make that so, I'm sure a few things have slipped by here and there - in no small part because of the hurried conditions under which I added features to ChartBuilder. If you see a strange behavior and don't think it's a bug in Charting, please let me know because it may be ChartBuilder that's at fault!

Are there any good usability tricks worth sharing?

  • Not all series types support all axis combinations. Specifically, it's not possible to put a column series and a bar series in the same chart because they put their independent/dependent axes in different places. Similarly, column and line don't go together because column only supports a category-based independent axis while line only supports a value-based (numeric or date) independent axis. Here's a quick cheat-sheet:
    Series Independent axis Works with
    Column Category Column, Pie
    Bar Vertical Category Bar, Pie
    Pie N/A Everything
    Line Number/Date Line, Scatter, Pie
    Scatter Number/Date Line, Scatter, Pie
  • The text input boxes validate their contents and update the chart state after every key press. This can make it tricky to make certain changes because the intermediate states are invalid. If you run into this situation, there are two tricks to try. First, see if you can select part of the text field and then type over it (ex: "10/28/2008" can be change to "10/29/2008" in one step by selecting the '8' and typing a '9'). If that doesn't help, another option is to open a Notepad window, type what you want there, copy it to the clipboard, select the entire text box in ChartBuilder and paste over it with the intended value.
  • The "Number of Axes" slider is disabled whenever there are one or more series present. This is because as soon as a series is rendered, it automatically creates whatever axes it needs to display itself - so if the user tried to add another axis, there would be multiple horizontal/vertical axes. At this time, Charting supports only a single horizontal and a single vertical axis - though please note that this restriction will be removed in an upcoming release to support multiple horizontal and vertical axes on the same chart. So if you want to customize the axes for your chart, first remove all the series, then add the axes you want, then add the series back - assuming the axis configuration that's set is supported by the series that are added, they will automatically use the provided axes and you will be able to customize them dynamically.
  • When "Allow XAML Editing" is checked, the XAML is completely re-parsed and the chart re-created after every keystroke. Similarly, when unchecking that option, the state stored in the input controls on the left is re-applied and the text in the XAML editing box is lost. Basically, once the option to edit XAML is enabled, ChartBuilder has no idea what the user has done and no way of mapping that back to the subset of changes it supports. So feel free to experiment with XAML mode (it's great for stuff like adding a colored background or extra data), but know that you're completely on your own when you do so.
  • ChartBuilder makes use of two classes it exposes via the "utility" XML namespace: ObservableObjectCollection and Pair. ObservableObjectCollection is simply an ObservableCollection<object> and Pair is just an object that exposes two properties "First" and "Second" of type object. These are purely convenience classes that make the XAML easy to deal with; you're welcome to make use of them in your own application if you care to.
  • ChartBuilder does its best to capture all exceptions that occur and display them in its user interface. This is quite handy when running outside of Visual Studio, but in order for it to have a chance to work when running under a debugger, be sure to configure the debugger to ignore handled exceptions (or just hit F5 when one occurs to allow ChartBuilder to catch and handle the exception).

What are examples of some issues I might encounter?

  • Removing and re-adding a series over and over gives that series a different color each time. This is an artifact of how the Chart.StylePalette collection works: each time a new style is needed, it is fetched from the palette and the "next style" index incremented. So as long as the same chart instance is being used, recreating a series over and over gradually cycles through all the different colors of the default style palette. As soon as a new chart instance is created, the style palette is reset and the colors start from the beginning. In other words, the "random" behavior is completely deterministic and will always be the same for a particular application. If you want to guarantee that a particular series will always have the same color no matter what, there is a DataPointStyle property on Column/Bar/Line/ScatterSeries and a dedicated StylePalette property on PieSeries that can be set in code (but is not exposed by ChartBuilder at this time).
  • Removing the Chart (or Legend) Title does not automatically recover the space used by the text of that control (until something like a resize causes another layout pass). This is actually a Silverlight bug with ContentControl (which is what Title is) and can be reproduced outside Charting by placing a ContentControl in a StackPanel between two other elements and setting its Content property to null. This bug has been reported to the Silverlight team and should be fixed in a future release.
  • The default appearance of the line and scatter charts in "Automatic Doubles" mode is always a straight line (with a slope of 1) and the points just slide along it. "Manual Pairs" mode is the only mode that really makes sense for line and scatter because they need numeric independent values - but just so that "Automatic Doubles" and "Manual Doubles" modes show something, ChartBuilder automatically sets their IndependentValueBinding to "{Binding}". This provides an independent value, but it's always the same as the dependent value and so the points always lie on the same line. To really exercise line and scatter, switch to "Manual Pairs" mode, click the "All Doubles" button for both columns, enable a couple of points, and then have fun changing values.
  • Adding a point to the middle of the collection for line, bar, and pie charts adds that point to the end of the visual series. ChartBuilder's "Manual Doubles" and "Manual Pairs" modes allow you to individually enable and disable points - and specifically to "insert" points at the beginning, middle, or end of the collection. This is what ChartBuilder does internally (verify by looking at the XAML or clicking "Recreate Chart"), but the aforementioned series add that point to the end of their internal collections, so the new point always shows up after the existing points. This is a known issue to be addressed in a future release of Charting; it can be worked around for now by clicking "Recreate Chart".
  • Multiple occurrences of the same data point instance in the collection can get their visual representations mixed up. This can be seen by starting from the default ChartBuilder configuration, then increasing the "Starting Value" twice (from 1 to 3) - the columns of the resulting chart should increase in height from left to right, but do not. What happens is that the collection goes from [2, 3, ...] to [3, 3.6, ...] when the starting value goes from 2 to 3. As soon as the first value of the collection changes from 2 to 3, there are two instances of the value 3 in the collection: [3, 3, ...]. When the second value changes from 3 to 3.6, the chart incorrectly updates the column corresponding to the first point. This is unfortunate behavior, but is actually also present in the WPF and Silverlight ListBox implementations (though it manifests itself differently there). The basic problem is that the chart tracks things by object identity and the presence of the same object multiple times creates ambiguity for the tracking code. The good news is that this problem is only really an issue when the data set contains raw doubles or integers - the far more common scenario (in practice) of using unique business objects is unaffected by this because each business object is a unique instance. To verify this, switch to "Manual Pairs" mode for the column series, enable three points, set all their values to 1, then change any of them to a different value and observe that the correct column is always updated.
  • Changing the independent value of a pie series data point (in "Manual Pairs" mode) does not automatically update the label for that data point in the legend. This is a known issue to be addressed in a future release of Charting; it can be worked around for now by clicking "Recreate Chart".
  • There are certain circumstances under which toggling "Show GridLines" and "Should Include Zero" for a custom axis cause the axis to disappear (and the chart not to render). This is a known issue to be addressed in a future release of Charting; it can be worked around for now by clicking "Recreate Chart".

Any last words?

I wrote ChartBuilder to help you learn about Charting as much as to help us develop Charting. If it provides everyone with a common language that helps make it easy to talk about Charting features, suggestions, and issues, I'll be delighted!

And now... Enjoy! :)