The blog of dlaa.me

If one proxy is good, two must be better [Socks5to4a gives your SOCKS 4a proxy a free upgrade!]

I occasionally find myself on a particular network that's separated from the rest of the Internet by a firewall. The administrators of this network are kind enough to provide both HTTP and SOCKS 4a proxy servers, so it's generally quite easy to get access to the Internet in spite of the firewall. Unfortunately, a couple of the programs I use from time to time support only the SOCKS 5 protocol which is not backwards compatible with the SOCKS 4a protocol...

Well, after bumping into this problem again recently, I checked the SOCKS specifications on Wikipedia and decided it would be pretty straightforward to write a SOCKS 5 proxy server that forwarded all its traffic to a SOCKS 4a proxy server to do the real work. There's just not that much to a proxy server - especially when you're only interested in supporting TCP/IP streams and aren't hoping for production-quality code. :)

So I dashed off a program called Socks5to4a that does exactly what I envisioned. I just run it on my machine, tell it how to connect to the network's SOCKS 4a server, and point my SOCKS 5 applications at localhost. The programs all think they're talking to a real SOCKS 5 server and the network's SOCKS 4a server thinks it's talking to a real SOCKS 4a client - and they're almost right!

With Socks5to4a, things couldn't be simpler - here's what it looks like in action:

D:\T>Socks5to4a myproxy 1080 fallback.example.com
0: Listening on localhost:1080 with fall-back to fallback.example.com...
1: Accepted connection.
1: Reading client request...
1: Client requests fallback.example.com:1234.
1: Connecting to proxy...
1: Connected.
1: Forwarding request...
1: Connected.
1: Sending response...
1: Proxying data...
2: Accepted connection.
2: Reading client request...
2: Client requests fallback.example.com:1234.
2: Connecting to proxy...
2: Connected.
2: Forwarding request...
2: Connected.
2: Sending response...
2: Proxying data...
3: Accepted connection.
3: Reading client request...
3: Client requests 192.168.1.6:2345.
3: Connecting to proxy...
3: Connected.
3: Forwarding request...
3: Connect failed.
3: Retrying with fallback.example.com:2345...
3: Connected.
3: Sending response...
3: Proxying data...
3: Connection closed.
1: Connection closed.
2: Connection closed.

If you paid close attention to the above trace, you probably noticed the "fall-back" behavior. What's going on is that one of the applications I use connects to a server that misreports its public IP address - so subsequent attempts to connect to that IP fail. What I did is add a bit of smarts to Socks5to4a so I can specify an optional fall-back server when I run it; and then any connection failures are automatically (and seamlessly) retried using the fall-back server. Because the fall-back server is used only when necessary, this kludge stays out of the way until it's needed. At which point it's elegant and icky at the same time... :)

Socks5to4a is something I wrote to solve a specific problem I was having - but if it's interesting to you, please go ahead and have a look or give it a try. However, please remember that I specifically did not set out to create the world's best or fastest SOCKS 5 server - the code I wrote works well enough for my scenarios, but may need a bit of tweaking for yours.

[Click here to download the Socks5to4a application along with its complete source code.]

Happy proxying!

A bit more(er) than meets the eye [Easily animate and update LayoutTransformer with AnimationMediator!]

Yesterday I posted the code for AnimationMediator, a simple Mediator class to make it easy to animate the Transitions of a LayoutTransformer. Today, Silverlight Toolkit teammate Ted Glaza asked why the LayoutTransformerName property was present and I said that while I'd really wanted to use Binding+ElementName with the LayoutTransformer property, it didn't work for me when I tried. Ted kindly pointed out that in order for that to succeed, the LayoutTransformer property needed to be a DependencyProperty - and I'd used a simple CLR property instead. :(

Aside: What happened is that I originally used a DependencyProperty, convinced myself it wasn't working, then simplified to a plain CLR property. But I obviously did something wrong along the way, because the scenario I wanted to enable works great once LayoutTransformer is a DependencyProperty.


So I've updated the implementation of AnimationMediator accordingly; you can get the new version by downloading the source code again - or from below. And with this update there's no need to use the LayoutTransformerName property on Silverlight 3 (in fact, I've removed it from the code!) - so the scenario from last time simplifies to the following:

<local:AnimationMediator
    x:Name="RotationMediator"
    LayoutTransformer="{Binding ElementName=ButtonTransformer}"
    AnimationValue="{Binding Angle, ElementName=Rotation, Mode=TwoWay}"/>
Aside: Binding's ElementName property isn't present on Silverlight 2, so the LayoutTransformerName property is still relevant on that platform. Therefore, I have not changed the AnimationMediator implementation I originally included in the text of yesterday's post.


AnimatingLayoutTransformer Demo


[Click here to download the complete source code for the AnimationMediator sample application.]


As long as I was updating the sample application, I wanted to take the opportunity to show off two other things as well. The first is that AnimationMediator is good for more than just Storyboards - you can also use it with XAML-only bindings to other UI elements! In this case, I've added a TextBlock and two Sliders and hooked those Sliders up to the ScaleTransform of a LayoutTransformer for the text. As you'll see if you run the demo, it works just like you'd expect and it's 100% XAML, no code. :) The second thing I wanted to show is a proof of my claim that you can use two AnimationMediators with the same LayoutTransformer - which I do here.

This is what the XAML for the new scaling scenario looks like:

<!-- Applies the LayoutTransform for TextBlock -->
<layoutToolkit:LayoutTransformer
    x:Name="TextTransformer">

    <!-- A scale transformation-->
    <layoutToolkit:LayoutTransformer.LayoutTransform>
        <ScaleTransform
            x:Name="Scale"/>
    </layoutToolkit:LayoutTransformer.LayoutTransform>

    <!-- Text being scaled -->
    <TextBlock
        Text="Scale Me!"
        FontSize="50"
        FontWeight="Bold"
        HorizontalAlignment="Center"
        VerticalAlignment="Center"/>

</layoutToolkit:LayoutTransformer>

<!-- An AnimationMediator for each Slider Binding -->
<local:AnimationMediator
    x:Name="ScaleXMediator"
    LayoutTransformer="{Binding ElementName=TextTransformer}"
    AnimationValue="{Binding ScaleX, ElementName=Scale, Mode=TwoWay}"/>
<local:AnimationMediator
    x:Name="ScaleYMediator"
    LayoutTransformer="{Binding ElementName=TextTransformer}"
    AnimationValue="{Binding ScaleY, ElementName=Scale, Mode=TwoWay}"/>

<!-- A Slider for X and Y -->
<Slider
    Maximum="5"
    Value="{Binding AnimationValue, ElementName=ScaleXMediator, Mode=TwoWay}"
    Grid.Row="1"/>
<Slider
    Maximum="5"
    Value="{Binding AnimationValue, ElementName=ScaleYMediator, Mode=TwoWay}"
    Grid.Row="2"/>


So thanks for pointing this out, Ted - AnimationMediator is now just about as simple as can be!


PS - Here's the updated implementation of AnimationMediator:

/// <summary>
/// Class that acts as a Mediator between a Storyboard animation and a
/// Transform used by the Silverlight Toolkit's LayoutTransformer.
/// </summary>
/// <remarks>
/// Works around an issue with the Silverlight platform where changes to
/// properties of child Transforms assigned to a Transform property do not
/// trigger the top-level property changed handler (as on WPF).
/// </remarks>
public class AnimationMediator : FrameworkElement
{
    /// <summary>
    /// Gets or sets a reference to the LayoutTransformer to update.
    /// </summary>
    public LayoutTransformer LayoutTransformer
    {
        get { return (LayoutTransformer)GetValue(LayoutTransformerProperty); }
        set { SetValue(LayoutTransformerProperty, value); }
    }
    public static readonly DependencyProperty LayoutTransformerProperty =
        DependencyProperty.Register(
            "LayoutTransformer",
            typeof(LayoutTransformer),
            typeof(AnimationMediator),
            new PropertyMetadata(LayoutTransformerPropertyChanged));
    private static void LayoutTransformerPropertyChanged(
        DependencyObject o,
        DependencyPropertyChangedEventArgs e)
    {
        var layoutTransformer = (LayoutTransformer)(e.NewValue);
        if (null != layoutTransformer)
        {
            // Update now to be safe
            layoutTransformer.ApplyLayoutTransform();
        }
    }

    /// <summary>
    /// Gets or sets the value being animated.
    /// </summary>
    public double AnimationValue
    {
        get { return (double)GetValue(AnimationValueProperty); }
        set { SetValue(AnimationValueProperty, value); }
    }
    public static readonly DependencyProperty AnimationValueProperty =
        DependencyProperty.Register(
            "AnimationValue",
            typeof(double),
            typeof(AnimationMediator),
            new PropertyMetadata(AnimationValuePropertyChanged));
    private static void AnimationValuePropertyChanged(
        DependencyObject o,
        DependencyPropertyChangedEventArgs e)
    {
        ((AnimationMediator)o).AnimationValuePropertyChanged();
    }
    private void AnimationValuePropertyChanged()
    {
        if (null == LayoutTransformer)
        {
            throw new InvalidOperationException(
                "AnimationMediator's LayoutTransformer property must not be null.");
        }
        // The Transform hasn't been updated yet; schedule an update to run after it has
        Dispatcher.BeginInvoke(() => LayoutTransformer.ApplyLayoutTransform());
    }
}

A bit more than meets the eye [Easily animate LayoutTransformer with AnimationMediator!]

I came across a question on the Silverlight Toolkit support forum yesterday asking how to animate the values of a Transform used by the Silverlight Toolkit's LayoutTransformer. (Background on LayoutTransformer: Motivation and introduction for Beta 1, Significant enhancements and update for Beta 2, Update for RTW, Fixes for two edge case bugs, Usefulness on WPF, Rename for Silverlight Toolkit.) As the questioner discovered, this task isn't quite as easy as it should be due to a difference between Silverlight and WPF.

Aside: I describe the Silverlight limitation in more detail under the third bullet point of the "Notes" in this post (though that workaround has since been invalidated per the first bullet point of the "Notes" of this post).
AnimatingLayoutTransformer Demo

I wanted something that was simple and easy to use - and managed to come up with a pretty reasonable XAML-only solution on my second try. [The first attempt would have been a bit simpler, but didn't work out. :( ] The basic idea is to insert a Mediator between the animation and the LayoutTransformer and let the Mediator make sure the LayoutTransformer is updated when necessary. This task is complicated slightly by the fact that Silverlight won't let you create a Binding on one of its Transforms - but the equivalent effect can be had by putting a TwoWay Binding on the Mediator instead (as discussed in more detail by Jeff Prosise here).

This is what the XAML for the above sample looks like:

<Grid.Resources>
    <!-- Storyboard to animate the Button; targets AnimationMediator -->
    <Storyboard x:Key="Animation">
        <DoubleAnimation
            Storyboard.TargetName="RotationMediator"
            Storyboard.TargetProperty="AnimationValue"
            To="180"
            AutoReverse="True"
            Duration="0:0:0.3"/>
    </Storyboard>
</Grid.Resources>

<!-- Target of animation; forwards changes to the RotateTransform -->
<local:AnimationMediator
    x:Name="RotationMediator"
    LayoutTransformerName="ButtonTransformer"
    AnimationValue="{Binding Angle, ElementName=Rotation, Mode=TwoWay}"/>

<!-- Applies the LayoutTransform for Button -->
<layoutToolkit:LayoutTransformer
    x:Name="ButtonTransformer"
    Grid.Column="1"
    Grid.Row="1">

    <!-- A simple transformation -->
    <layoutToolkit:LayoutTransformer.LayoutTransform>
        <RotateTransform
            x:Name="Rotation"/>
    </layoutToolkit:LayoutTransformer.LayoutTransform>

    <!-- Button being animated -->
    <Button
        Content="Click to Animate!"
        Click="Button_Click"
        FontSize="30"/>

</layoutToolkit:LayoutTransformer>

The sample application is written for Silverlight 3 because I wanted to make use of the new ElementName feature to keep things simple - but the basic idea applies to Silverlight 2 just the same. (However, please note that it may be necessary to hook up the Binding with code on that platform.) And if you find that you need to support multiple Transforms, just add a few more AnimationMediators to the mix! :)

There you have it - with just a little bit of extra typing to add an AnimationMediator, the original scenario works quite nicely!


[Click here to download the complete source code for the AnimationMediator sample application.]


PS - Here's the implementation of AnimationMediator:

Updated 2009-04-10: Please see this post for an update that makes AnimationMediator a little easier to use on Silverlight 3.

/// <summary>
/// Class that acts as a Mediator between a Storyboard animation and a
/// Transform used by the Silverlight Toolkit's LayoutTransformer.
/// </summary>
/// <remarks>
/// Works around an issue with the Silverlight platform where changes to
/// properties of child Transforms assigned to a Transform property do not
/// trigger the top-level property changed handler (as on WPF).
/// </remarks>
public class AnimationMediator : FrameworkElement
{
    /// <summary>
    /// Gets or sets a reference to the LayoutTransformer to update.
    /// </summary>
    public LayoutTransformer LayoutTransformer { get; set; }

    /// <summary>
    /// Gets or sets the name of the LayoutTransformer to update.
    /// </summary>
    /// <remarks>
    /// This property is used iff the LayoutTransformer property is null.
    /// </remarks>
    public string LayoutTransformerName
    {
        get
        {
            return _layoutTransformerName;
        }
        set
        {
            _layoutTransformerName = value;
            // Force a new name lookup
            LayoutTransformer = null;
        }
    }
    private string _layoutTransformerName;

    /// <summary>
    /// Gets or sets the value being animated.
    /// </summary>
    public double AnimationValue
    {
        get { return (double)GetValue(AnimationValueProperty); }
        set { SetValue(AnimationValueProperty, value); }
    }
    public static readonly DependencyProperty AnimationValueProperty =
        DependencyProperty.Register(
            "AnimationValue",
            typeof(double),
            typeof(AnimationMediator),
            new PropertyMetadata(AnimationValuePropertyChanged));
    private static void AnimationValuePropertyChanged(
        DependencyObject o,
        DependencyPropertyChangedEventArgs e)
    {
        ((AnimationMediator)o).AnimationValuePropertyChanged();
    }
    private void AnimationValuePropertyChanged()
    {
        if (null == LayoutTransformer)
        {
            // No LayoutTransformer set; try to find it by LayoutTransformerName
            LayoutTransformer = FindName(LayoutTransformerName) as LayoutTransformer;
            if (null == LayoutTransformer)
            {
                throw new InvalidOperationException(string.Format(CultureInfo.CurrentCulture,
                    "AnimationMediator was unable to find a LayoutTransformer named \"{0}\".",
                    LayoutTransformerName));
            }
        }
        // The Transform hasn't been updated yet; schedule an update to run after it has
        Dispatcher.BeginInvoke(() => LayoutTransformer.ApplyLayoutTransform());
    }
}

Nobody likes seeing the hourglass... [Keep your application responsive with BackgroundTaskManager on WPF and Silverlight]

In my last post I talked about the source control repository browser project I've been playing around with and mentioned that one of my primary goals was for the application to be "Completely asynchronous so that one or more long-running network tasks wouldn't hang the user interface". Some of you asked me to go into more detail about how this application works, and I thought I'd begin by discussing the asynchronous aspect.

The challenge here is that sometimes an application needs to perform a long-running task and it doesn't want to do so on the user interface thread because that causes noticeable delays and those make users grumpy. (Any time you see an application become completely unresponsive and stop updating its window, that's probably because the UI thread is busy doing something other than updating the UI...)

Fortunately, there's usually an API available for potentially long-running tasks that is written according to one of the common asynchronous programming design patterns. When that's the case, making use of the provided construct is almost always the preferred option because the API's authors are in the best position to provide the right abstractions and interfaces. However, sometimes you'll find that the only API or technique for accomplishing what you need is synchronous. In these cases, the best choice is usually to move as much of the operation as possible to a separate thread in order to avoid bogging down the UI thread.

BackgroundTaskManagerDemo on WPF

.NET provides a number of ways to accomplish this, one of which is the BackgroundWorker class. BackgroundWorker tries to make asynchronous operations easy and - while it's not something I find myself using often - is well suited to the problem at hand! Specifically, all that's needed to avoid hanging the UI is to push the brunt of the work to the DoWork event and then add a bit of code to the RunWorkerCompleted event to take the result of that work and update the user interface accordingly.

Aside: There are at least two high level approaches to updating the user interface after a long-running task: by updating the (bound) data and/or view model with the new values or by manipulating the UI directly to show those values. Both approaches work, but one of the things I find very elegant about the WPF and Silverlight architecture is how well suited it is to supporting rich data binding across an entire application. In particular, one of the great things that comes from an application which makes strong use of data binding is that there's typically very little need to directly manipulate the UI. Which means there's also a great deal less code that needs to be written to keep track of the exact state of the UI and make sure that overlapping updates don't conflict with each other.

Because when you're managing all the UI yourself, you need to be sure that the results of a background task are still relevant by the time they're available (for example, that the user hasn't changed tasks, reconfigured the window, etc.). But when you're using data binding and updating the model the UI is bound to, the right thing "just happens" without any special effort on your part. If the new data is still relevant, it shows up exactly where it's supposed to - and if it's no longer applicable, it just doesn't show up. And if the user switches back to what they were doing, the new data is automatically used.

Synchronization can be tricky to get right, so being able to avoid it entirely by taking advantage of WPF and Silverlight's rich data binding support is a big win!


For the purposes of my source control repository viewer application, every call to the local source control client (ex: TF.exe or SVN.exe) is a synchronous call and is assumed to take a long time to complete. Granted, in the best case, a particular call might not need to contact the server and will complete quickly - but in the worst case, the call to the server ends up getting queued behind a backlog of other long-running commands and takes tens of seconds (or more!) to complete. I obviously don't want the interface of my application to block during this time - and furthermore I don't want to prevent the user from performing other operations just because a particular one is taking a long time to complete. For example, the user may have just requested a recursive history of the entire repository and is fully expecting for the command to take a while to complete. But there's no reason that should prevent him or her from simultaneously initiating a much simpler request to do something like view the list of pending changes. Therefore, every call to the source control client is run on a background thread and when the results come back they are used to update the model - at which point pervasive data binding automatically propagates those changes to the user interface!

BackgroundTaskManagerDemo on Silverlight

It's a fairly simple programming model, but a powerful one, and it leaves the application's UI snappy and responsive no matter what the user does, how fast the network is, or how overloaded the server may be. :)


All long-running tasks are initiated via the BackgroundTaskManager class which is a thin wrapper around BackgroundWorker. The additional functionality this wrapper provides is tracking of the number of active background tasks (which is automatically reflected in the UI to help the user understand what's going on) and a slightly more convenient interface for specifying the code that runs in the background and upon completion. Here's what a typical call to BackgroundTaskManager from the UI thread looks like (from the sample application):

BackgroundTaskManager.RunBackgroundTask(
    () =>
    {
        // Task function runs in the background
        return ComputeValue(TimeSpan.FromSeconds(durationInSeconds));
    },
    (result) =>
    {
        // Completion function runs on the UI thread
        UseValue(result);
        Log(string.Format(CultureInfo.CurrentCulture,
            "Finished asynchronous task taking {0} seconds", durationInSeconds));
    });

The two methods that get passed to RunBackgroundTask can do anything you want - with one important restriction: the background task function must not do anything that directly manipulates the user interface. This is a platform limitation that anyone who's done much threading with WPF or Silverlight is probably familiar with: only the UI thread is allowed to manipulate the UI. So the pattern I follow is that the background task's only responsibility is to perform the time-consuming operation (ex: the call to the source control server). The result of this computation is handed directly to the completion function which has the responsibility of updating the UI either directly or through the model. It's an easy model to develop against and has proven pretty valuable so far.

Here's the complete implementation of BackgroundTaskManager:

/// <summary>
/// Class that manages the execution of background tasks.
/// </summary>
public static class BackgroundTaskManager
{
    /// <summary>
    /// Event invoked when a background task is started.
    /// </summary>
    [SuppressMessage("Microsoft.Usage", "CA2211:NonConstantFieldsShouldNotBeVisible",
        Justification = "Add/remove is thread-safe for events in .NET.")]
    public static EventHandler<EventArgs> BackgroundTaskStarted;

    /// <summary>
    /// Event invoked when a background task completes.
    /// </summary>
    [SuppressMessage("Microsoft.Usage", "CA2211:NonConstantFieldsShouldNotBeVisible",
        Justification = "Add/remove is thread-safe for events in .NET.")]
    public static EventHandler<EventArgs> BackgroundTaskCompleted;

    /// <summary>
    /// Runs a task function on a background thread; invokes a completion action on the main thread.
    /// </summary>
    /// <typeparam name="T">Type of task function result.</typeparam>
    /// <param name="taskFunc">Task function to be run on a background thread.</param>
    /// <param name="completionAction">Completion action to run on the primary thread.</param>
    public static void RunBackgroundTask<T>(Func<T> taskFunc, Action<T> completionAction)
    {
        // Create a BackgroundWorker instance
        var backgroundWorker = new BackgroundWorker();

        // Attach to its DoWork event to run the task function and capture the result
        backgroundWorker.DoWork += delegate(object sender, DoWorkEventArgs e)
        {
            e.Result = taskFunc();
        };

        // Attach to its RunWorkerCompleted event to run the completion action
        backgroundWorker.RunWorkerCompleted += delegate(object sender, RunWorkerCompletedEventArgs e)
        {
            // Invoke the BackgroundTaskCompleted event
            var backgroundTaskFinishedHandler = BackgroundTaskCompleted;
            if (null != backgroundTaskFinishedHandler)
            {
                backgroundTaskFinishedHandler.Invoke(null, EventArgs.Empty);
            }

            // Call the completion action
            completionAction((T)e.Result);
        };

        // Invoke the BackgroundTaskStarted event
        var backgroundTaskStartedHandler = BackgroundTaskStarted;
        if (null != backgroundTaskStartedHandler)
        {
            backgroundTaskStartedHandler.Invoke(null, EventArgs.Empty);
        }

        // Run the BackgroundWorker asynchronously
        backgroundWorker.RunWorkerAsync();
    }
}


The sample application associated with this post lets you play around with synchronous and asynchronous operations of different durations. The red buttons on the left make synchronous calls that hang the entire application UI for the duration of the call (0, 2, or 10 seconds). (For fun, start a 10 second synchronous operation and then start clicking around the window - before long Windows will tag it as "Not responding" and gray the entire window out to reinforce the fact!) The green buttons on the right make asynchronous calls and leave the rest of the application completely responsive. You can queue up as many or as few simultaneous asynchronous calls as you'd like - they all run in parallel and without conflict. The status display shows the current number of pending asynchronous operations and helps to communicate what's going on in the background.

[Click here to download the source code for BackgroundTaskManager and the WPF/Silverlight sample applications shown above.]

One other thing that's worth pointing out is that while I originally wrote this code exclusively for use with WPF, it runs fine without changes on Silverlight as well (which you can see in the second screenshot above). In fact, the entire sample application is built from the exact same source code and XAML for both WPF and Silverlight (thanks to file linking)!


Whatever platform you're on, if your application has things to do and those things take time, please do what you can to keep your application responsive by doing that work off the UI thread. BackgroundTaskManager makes this easy, but your users will appreciate your efforts no matter how you solve the problem! :)

If you could have this... would you even *want* it? [Playing around with writing a flexible source control repository browser in WPF]

I've spent some of my time during the bus ride to/from the office experimenting with creating a flexible source control repository browser in WPF. I started this project as a learning exercise for myself and to address a particular need. As it stands today, I've managed to get far enough along that I've more-or-less accomplished my goals - and I'm not sure where I want to go with it next... :)

RepositoryExplorer main view

Thinking back a bit, this project started when I decided to see what it would be like to write my own standalone version control system (VCS) browser that worked with both Subversion and Team Foundation Server. You're probably wondering why (ignoring the educational benefits of such a thing) I would decide do this - well, the motivation actually came from two directions almost at once:

  1. I switched to Subversion for the source control provider I use for non-day-job projects. I'd picked Subversion for two main reasons: a great offline story and a dependency-free install. But my concern was that I couldn't seem to find a good, free UI-oriented repository viewer that wasn't implemented as a Windows shell extension. (Yes, I know about TortiseSVN and it looks like a fantastic tool - but I have this strong [and only semi-rational ;) ] objection to installing shell extensions.)
  2. I came to realize that although TFS's seamless integration with Visual Studio is beautiful when everything works, it gets kind of painful once there are any sort of problems with the server or network. I had the misfortune of hitting a pretty bad batch of such problems and grew quite tired of the entire Visual Studio application hanging whenever some little part of it decided to make a request to TFS and the response didn't come back immediately. :(

So as long as I was going to set off down my own path, I outlined a set of goals to make my project the perfect source control browser (for me, at least!). Specifically, my tool would be:

  • Source control system agnostic (i.e., it should be easy to add support for ANY reasonable source control)
  • Completely asynchronous so that one or more long-running network tasks wouldn't hang the user interface
  • Network-friendly by making as few network calls as possible and caching results wherever possible
  • Simple and easy to use without sacrificing usefulness
  • Read-only (i.e., easily browsing change-logs with a friendly, point-and-click user interface is very much a goal; performing a check-in with multiple merge conflicts is not)
  • Small and self-contained (a single executable)
  • Require no installation
  • Have no external dependencies (once you have the tools to access your VCS of choice, you don't need anything else)
  • Harness the power of WPF
RepositoryExplorer difference view

Like I said, I've been working on this off-and-on for a while now and what I've got is starting to suit my needs pretty well. In fact, I've been using it nearly every day for a couple of weeks! Of course, I've got a big TODO list of enhancements and features I'd like to add, but from the point of view of an interesting learning exercise and a solution to my original problems, I've kind of accomplished what I set out to do. So I'd consider this project a success even if I kept it to myself and continued refining things gradually over the coming months...

But I'm kind of curious if this is something of more general interest to the community:

  • Are there folks who might want to use something like this themselves?
  • Should I write a couple of blog posts on how I tackled some of the problems here? [In particular, I think the fully asynchronous model is kind of sweet - but then again, I'm a little biased... :) ]
  • Is there value in sharing the code for a small WPF application (as opposed to blogging small, one-off demonstrations of individual concepts)?
  • ...

If you've got an opinion on the matter, please leave a comment below or send me feedback - I'd love to hear from people like you!

Tags: WPF

Don't let the gotchas getcha [Adding the ScrollIntoViewCentered method to WPF's ListBox]

I recently found myself wanting a method I could call to bring one of the items in a WPF ListBox into view. In my scenario, the user would recognize the item when he/she saw it, so my problem wasn't about setting focus or rendering a highlight; it was just about bringing the item into view so it could be seen and manipulated. I started in the obvious place: the ListBox.ScrollIntoView method. Sure enough, a call to this method scrolled the item into view just like it was supposed to - and yet I wasn't completely satisfied... :)

You see, I didn't just want the item to be visible, I wanted it to be centered as well. I can't imagine I'm the first person to want to do this, but a quick web search didn't turn up anything relevant. I figured it'd be easy enough to write some code to implement the behavior myself, so I turned the problem over a bit in my head and was all giddy when I caught a gotcha prior to coding. :) Then, having decided on the implementation, I went ahead and typed up my ScrollIntoViewCentered extension method and gave it a try...

Darn... While my code worked as well as ScrollIntoView, it also wasn't any better. Specifically, the item wasn't centered like I wanted... :( A little poking around and some targeted experimentation turned up a second gotcha I'd missed. Once I'd addressed the second issue, the code worked fine and I continued with what I was originally doing.

ListBoxExtensionsDemo sample

[Click here to download the code for the ListBoxExtensionsDemo sample application.]


You can find the complete code for ScrollIntoViewCentered below; here's a quick discussion of the two gotchas:

  • VirtualizingStackPanel.IsVirtualizing must be False. This is the gotcha I caught before coding. Basically, in order for the call to ItemContainerGenerator.ContainerFromItem to succeed, the container must have already been generated - but there may not be a container if virtualization is enabled! As you might expect, ScrollIntoView has this same problem - which it solves by calling the internal VirtualizingPanel.BringIndexIntoView method... :( Losing virtualization doesn't matter for my scenario, so ScrollIntoViewCentered simply requires that it be set. (FYI: I can think of a couple of ways to remove this restriction, but none of them is particularly elegant...)
  • ScrollViewer.CanContentScroll must be False. This is the gotcha I missed. It turns out that the same exact code I have that works fine when ScrollViewer.CanContentScroll is disabled fails when it's enabled. This highlights one of the differences between logical scrolling (item-based) and physical scrolling (pixel-based). I haven't thought about it enough to decide if I think it's a bug that the technique I use doesn't work properly with logical scrolling, but (like above) the difference is not relevant to my scenario. (FYI: Again, I can think of some ways to remove this restriction, but again they're kind of ugly.)

The ScrollIntoViewCentered method is hardly rocket science - but it is pretty handy. :) Thanks to the magic of extension methods, it looks just like the ListBox API it was inspired by and ends up being both easy to discover and easy to use.

I hope you like it!


/// <summary>
/// Class implementing helpful extensions to ListBox.
/// </summary>
public static class ListBoxExtensions
{
    /// <summary>
    /// Causes the object to scroll into view centered.
    /// </summary>
    /// <param name="listBox">ListBox instance.</param>
    /// <param name="item">Object to scroll.</param>
    [SuppressMessage("Microsoft.Design", "CA1011:ConsiderPassingBaseTypesAsParameters",
        Justification = "Deliberately targeting ListBox.")]
    public static void ScrollIntoViewCentered(this ListBox listBox, object item)
    {
        Debug.Assert(!VirtualizingStackPanel.GetIsVirtualizing(listBox),
            "VirtualizingStackPanel.IsVirtualizing must be disabled for ScrollIntoViewCentered to work.");
        Debug.Assert(!ScrollViewer.GetCanContentScroll(listBox),
            "ScrollViewer.GetCanContentScroll must be disabled for ScrollIntoViewCentered to work.");

        // Get the container for the specified item
        var container = listBox.ItemContainerGenerator.ContainerFromItem(item) as FrameworkElement;
        if (null != container)
        {
            // Get the bounds of the item container
            var rect = new Rect(new Point(), container.RenderSize);

            // Find constraining parent (either the nearest ScrollContentPresenter or the ListBox itself)
            FrameworkElement constrainingParent = container;
            do
            {
                constrainingParent = VisualTreeHelper.GetParent(constrainingParent) as FrameworkElement;
            } while ((null != constrainingParent) &&
                     (listBox != constrainingParent) &&
                     !(constrainingParent is ScrollContentPresenter));

            if (null != constrainingParent)
            {
                // Inflate rect to fill the constraining parent
                rect.Inflate(
                    Math.Max((constrainingParent.ActualWidth - rect.Width) / 2, 0),
                    Math.Max((constrainingParent.ActualHeight - rect.Height) / 2, 0));
            }

            // Bring the (inflated) bounds into view
            container.BringIntoView(rect);
        }
    }
}
Tags: WPF

If they can build it, they will come... [Enabling anyone to compile WPF Charting from the Silverlight Charting sources!]

In yesterday's post I updated the unsupported public build of WPF Charting. The WPF version of the System.Windows.Controls.DataVisualization.Toolkit.dll assembly in that release is all that's needed to use Charting on WPF, so yesterday's update should to be enough to keep the WPF Charting early-adopters happy...

Well, except for the ones that want to be able to tinker with the code and build WPF Charting themselves. So today's post is for those of you who live life on the extreme edge - I'll enable you to build WPF Charting from the Silverlight Charting source code that ships in the March 09 release of the Silverlight Toolkit!

Okay, I've already said that we build WPF Charting from exactly the same sources as Silverlight Charting, so all that's really needed here is a new pair of CSPROJ/SLN files, right? Yes, for the most part, that's true - but there are a couple of other files involved... [There's always a catch, right? :) ]

The process of creating a WPF Charting "development environment" is pretty simple: We'll start with a clean copy of the Silverlight Toolkit source code for Silverlight 3. (Note: We could start from the Silverlight 2 Toolkit code just as easily, but if we did, then the Charting assembly would have the tiny, unnecessary limitation that it assumes Style properties are write-once. That's not the case on Silverlight 3 or WPF, so we'll create the WPF Charting environment from the Silverlight 3 sources.) If you haven't done so already, please download the Silverlight 3 Toolkit March 2009.msi from the Toolkit's CodePlex page and install it - making sure to leave the "Install source code" option enabled. Once the download is complete, extract the included Source code.zip file (you can find it in the Start Menu group for the Silverlight Toolkit) to an empty directory. Then extract the contents of Controls.DataVisualization.Toolkit.WPF.zip to the same directory (overwriting files when prompted).

Presto: You've got a Controls.DataVisualization.Toolkit.WPF directory containing a SLN you can open in Visual Studio 2008 and begin building immediately!


[Please click here to download Controls.DataVisualization.Toolkit.WPF.zip to start building WPF Charting.]


It's all very straightforward, but just in case I didn't explain the steps clearly, here's an example that goes through the whole process on the command line (you should be able to run the same basic commands on your machine):

C:\T>md WpfCharting

C:\T>cd WpfCharting

C:\T\WpfCharting>unzip "C:\Program Files\Microsoft SDKs\Silverlight\v3.0\Toolkit\March 2009\Source\Source code.zip"
Archive:  C:/Program Files/Microsoft SDKs/Silverlight/v3.0/Toolkit/March 2009/Source/Source code.zip
  ...
   creating: Controls.DataVisualization.Toolkit/
  inflating: Controls.DataVisualization.Toolkit/AggregatedObservableCollection.cs
   creating: Controls.DataVisualization.Toolkit/Charting/
  inflating: Controls.DataVisualization.Toolkit/Charting/AnimationSequence.cs
  ...

C:\T\WpfCharting>unzip ..\Controls.DataVisualization.Toolkit.WPF.zip
Archive:  ../Controls.DataVisualization.Toolkit.WPF.zip
replace Controls.DataVisualization.Toolkit/Charting/Series/DataPointSeries.cs? [y]es, [n]o, [A]ll, [N]one, [r]ename: y
  inflating: Controls.DataVisualization.Toolkit/Charting/Series/DataPointSeries.cs
replace Controls.DataVisualization.Toolkit/DependencyPropertyAnimationHelper.cs? [y]es, [n]o, [A]ll, [N]one, [r]ename: y
  inflating: Controls.DataVisualization.Toolkit/DependencyPropertyAnimationHelper.cs
replace Controls.DataVisualization.Toolkit/StoryboardQueue.cs? [y]es, [n]o, [A]ll, [N]one, [r]ename: y
  inflating: Controls.DataVisualization.Toolkit/StoryboardQueue.cs
   creating: Controls.DataVisualization.Toolkit.WPF/
  inflating: Controls.DataVisualization.Toolkit.WPF/Controls.DataVisualization.Toolkit.WPF.csproj
  inflating: Controls.DataVisualization.Toolkit.WPF/Controls.DataVisualization.Toolkit.WPF.sln
  inflating: Controls.DataVisualization.Toolkit.WPF/IEasingFunction.cs
   creating: Controls.DataVisualization.Toolkit.WPF/Properties/
  inflating: Controls.DataVisualization.Toolkit.WPF/Properties/AssemblyInfoWpf.cs
   creating: Controls.DataVisualization.Toolkit.WPF/Themes/
  inflating: Controls.DataVisualization.Toolkit.WPF/Themes/Generic.xaml
   creating: WpfToolkit/
  inflating: WpfToolkit/WPFToolkit.dll

C:\T\WpfCharting>Controls.DataVisualization.Toolkit.WPF\Controls.DataVisualization.Toolkit.WPF.sln

At this point, Visual Studio 2008 is open and you're ready to start WPF Charting development!


Okay, so what about those extra files - why are they necessary if WPF Charting is built from the same sources like I said it was? Well, first off, let's remember that Charting is made up of over 130 files - the extra files here are just a drop in the bucket! But I've got nothing to hide [ :) ], so we'll go through each of them to see why they're necessary:

Controls.DataVisualization.Toolkit.WPF.csproj
Controls.DataVisualization.Toolkit.WPF.sln
These two Visual Studio 2008 files create a solution/project that builds a WPF control assembly from the Charting source code. These are obviously necessary - and new for WPF Charting.
IEasingFunction.cs This file creates an empty definition of the IEasingFunction interface for code-level compatibility with Silverlight 3 where that interface is actually implemented. This empty interface definition avoids some #if/#endifs in the code, but otherwise does nothing. So there's nothing of interest here.
AssemblyInfoWpf.cs This file adds the WPF-specific, assembly-level ThemeInfoAttribute to the Charting assembly so that the styles in its Generic.xaml will be loaded properly. Nothing to see here, either.
Generic.xaml This file is an exact copy of the same file from the Silverlight 3 Charting code and is included here only because it's tricky to use file linking with Generic.xaml. Duplicating the file in this project is a nice, easy way to avoid the problem. Nope, no new code here!
DataPointSeries.cs
DependencyPropertyAnimationHelper.cs
StoryboardQueue.cs
These three files overwrite existing files from the Silverlight 3 Charting code and include the targeted fixes I made to Charting yesterday to work better on WPF. (Recall that my team has done absolutely no testing of WPF Charting.) There's actually nothing WPF-specific in any of these changes - and we would have included them in the Silverlight 3 Charting release if we'd known about them earlier. (In fact, they're already checked into our source control system and will be part of the next Charting release!) Yeah, there are some actual code changes here - but they're not specific to WPF!

And we're done! Yep, I really was serious when I said that WPF Charting builds from the same exact source code that Silverlight Charting builds from! :)

Thanks again for taking an interest in WPF Charting - I hope the ability to build it yourself makes it even more exciting!

Supporting the unsupported [Two fixes for the unofficial WPF Charting assembly!]

In my last post I described a few updates I made to my ChartBuilder sample/application/learning tool for the March 09 release of the Silverlight Toolkit. As usual, I posted the complete source code to ChartBuilder for interested parties to download and play around with. But this time around I also took the opportunity to showcase a WPF version of ChartBuilder that shows off an unofficial version of Silverlight Charting for WPF. Along with a WPF-based project file for ChartBuilder, I included a private build of the WPF Charting assembly that it compiles against.

I cautioned readers that WPF Charting was completely untested, but it was my not-so-secret hope that some of you would take the opportunity to play around with WPF Charting and give us some early feedback. And you did! :)

In addition to a known issue I describe in the previous post where dynamically added or removed DataPoints don't always complete their show/hide animations, kind reader abrien reported an additional problem causing a KeyNotFoundException during certain updates to a PieSeries's ItemsSource property. Then he/she went even further to create a CodePlex work item with a simple sample project demonstrating the problem! (Which is fantastic bug reporting, by the way!)

Now, before I go further, let me take this opportunity to reemphasize that neither of these problems is present in Silverlight Charting; they exist only in WPF Charting and are there because we've done absolutely no testing of WPF Charting due to a profound lack of time or resources. In fact, this is probably a good time to remind everyone of the warning I gave last time:

Warning: We have done absolutely no testing of the WPF Charting bits and if you decide to pull them out of the source code download and play around with them, then you do so at your own risk!

Okay, enough scare-mongering! :) The truth is that we'd love for people to be able to start experimenting with WPF Charting. So while the known show/hide problem was already bothering me, finding out about an exceptional condition arising from a fairly simple ChartBuilder scenario was downright unpleasant...

I spent some time over the weekend looking into both of these issues to see if I could identify the problem and perhaps fix it without too much fuss. And the good news is that I believe they're both fixed now! [After no small amount of frustration along the way... :) ] As it happens, both problems result from fairly subtle Storyboard behavior differences between Silverlight and WPF - though I'm happy to note the fixes I made are not platform specific. In other words, it's possible to write the exact same code on both platforms and have it work correctly on both platforms. It's just the code we started with wasn't that code... :(

I'm optimistic that both of these problems are behind us. And what's more, the fixes are already checked into our source control system for inclusion in the next release of Charting. But I don't want early adopters of WPF Charting to have to wait that long, so I've gone ahead and updated the WPF Charting assembly in the ChartBuilder download to include both of these fixes! If you're already playing around with WPF Charting, please take a moment to upgrade to the new version of System.Windows.Controls.DataVisualization.Toolkit.dll (file version 3.0.30324.1808) from the ChartBuilder download link below. And if you don't care about WPF Charting, then please don't worry about any of this - there are no other changes to the files in the download archive.

Our thanks go out to everyone who has given Silverlight Charting a try - and special thanks to our WPF Charting pioneers for their passion, feedback, and patience!


Please click here to download the complete ChartBuilder source code.


ChartBuilder on WPF

Silverlight Charting remains just a click away - and runs on WPF, too!! [ChartBuilder sample and source code updated for Charting's March 09 release]

In yesterday's announcement of the March 09 release of the Silverlight Toolkit and Silverlight Charting, I gave an overview of some new Charting features. One of the things I always do right after we release a new version of Charting is update my ChartBuilder sample/application/learning tool. If you're not already familiar with ChartBuilder, here's some background reading: Introduction/user's guide for November 08 release, Fix for non-US cultures, Update for December 08 release.

This time around is no different and I've just updated the live ChartBuilder application! It's a typical Silverlight 2 application, so you can run it with Silverlight 2 OR the newly released Silverlight 3 Beta.


Please click this text or the image below to run the latest ChartBuilder in your browser.

ChartBuilder on Silverlight

You can click here to download the complete ChartBuilder source code.


Release notes:

  • Added support for new series type AreaSeries.
  • Slightly better round-tripping behavior for doubles and DateTimes from the helper class Pair.
  • Various other minor improvements.
  • Updated the version to 2009-03-20.


Although we have - literally - thousands of automated test cases for Charting, ChartBuilder remains our de facto testing tool and has helped us to prevent or debug countless issues during the months we've been developing the Charting framework. I use it regularly to investigate strange behavior or to provide the scaffolding for one-off test cases that would otherwise require quite a bit of time and effort to create.

ChartBuilder won't win any awards for great user interface design, but it has been worth its weight in gold to us. I hope it helps you, too!


Oh, and one more thing... :)

It's always been our goal with Charting to support both Silverlight and WPF - and we've been compiling Charting for the WPF platform as part of our daily builds for the past few months. I thought it would be neat to show off a sneak preview of WPF Charting here, so I created a WPF build of ChartBuilder and hooked it up to the WPF build of Charting and - yup - it just worked. Well, mostly... :)

Warning: We have done absolutely no testing of the WPF Charting bits and if you decide to pull them out of the source code download and play around with them, then you do so at your own risk!

The great thing about what's going on here is that Silverlight Charting and WPF Charting are both compiled from exactly the same source code and XAML and allow you to use exactly the same source code and XAML in your projects. So you'll be able to create a chart on one platform and share it seamlessly with the other platform and you won't have to do any extra work! To help prove my point, ChartBuilder itself is built from exactly the same source code and XAML for both Silverlight and WPF!


ChartBuilder on WPF


The most obvious problem I've seen from playing around with WPF ChartBuilder for a little is that sometimes dynamically added/removed DataPoints don't play their reveal/show/hide transition properly. Some of the points coming in are obviously present in the chart because there's space reserved for them and their tooltips work properly - but they're not visible. And some of the points going out just don't go away like they're supposed to. My primary suspect here is VSM (the Visual State Manager; a Silverlight concept that's been ported to WPF); WPF Charting uses the WPF Toolkit's preview implementation of VSM and there may be some incompatibilities between that implementation and the one in Silverlight. Charting on WPF also has a few fit-and-finish issues; these are probably easy to fix, but like I said we haven't spent any time working on Charting for WPF.

Important: If you do decide to try WPF Charting, please note that it's necessary to add references to both the DataVisualization assembly and the WPFToolkit assembly or else you'll get a weird error from WPF when we attempt to use VSM and its implementation isn't present.


Okay, that's all I've got for now. :) I hope you have fun with Charting - on whatever platform you choose!

Silverlight Charting is faster and better than ever [Silverlight Toolkit March 09 release now available!]

We've just published the March 09 release of the Silverlight Toolkit and I bet there's something in there to make just about everyone happy! There are bug fixes for some of your favorite controls, a variety of cool new features sprinkled all around, and some completely new controls that will add a little more excitement to your next Silverlight application. The Toolkit continues to support everyone's ongoing Silverlight 2 development efforts and now also supports the newly released Silverlight 3 Beta. What's more, you get all of this goodness for the same low, low price of: free! :)

I encourage everyone to have a look at the live samples for Silverlight 2 or Silverlight 3, download the Toolkit installer(s), and enjoy the new stuff!

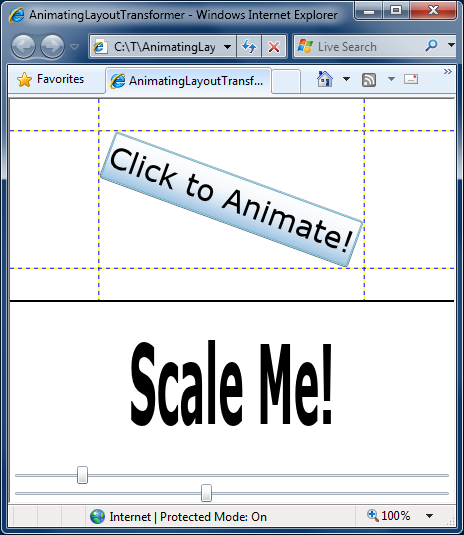
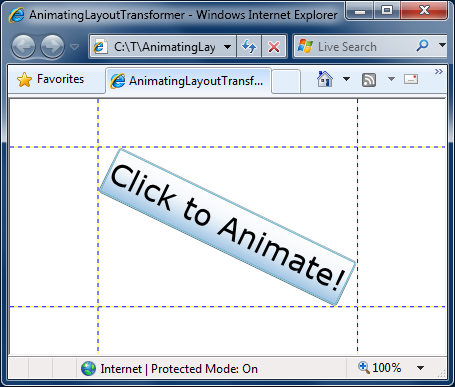
Aside: As a public service, I'll also direct your attention to the new LayoutTransformer control which didn't get its own sample page this time around, but remains near and dear to my heart. And if you look closely enough, you just might be able to spot LayoutTransformer being used by Accordion and Charting...


But enough about the rest of the Toolkit; you're probably here because you want to learn more about Silverlight Charting. Well, you've come to the right place! If you haven't already done so, this might be a good time to read or review my previous two introductory posts for Charting: this one for the initial November release and this one for the follow-up release in December. The March 09 release of Charting builds on the foundation Jafar and I previously established to add some new features, improve some usability scenarios, fix some bugs, and address what was easily our most common request: better performance!

Let's start with the full version of the Charting release notes (a simplified version of these notes is available on the "What's New" page for the Toolkit - but it omits all the juicy details):

Notable Changes

Significant performance improvements have been made to many parts of the Charting framework which yield noticeable speed-ups for scenarios dealing with large data sets. Because performance is one of those areas where it's easy to make improvements against benchmarks and yet achieve very little benefit that's relevant to the user, I won't cite the benchmark-based improvements our testing shows for this release. Instead, I'll share the anecdotal story of a Charting customer who got a chance to try an early version of the code and found that a scenario which was starting to bog down with around 500 points under the previous release could now manage over 5000 points with no difficulty! Your mileage may vary, of course, but we definitely think the new Charting core feels snappier!

Added new Series type AreaSeries which works just like LineSeries except that it fills in the area underneath the line. With the addition of AreaSeries in this release, Silverlight Charting now supports all of the major chart types offered by the top level of Excel's ribbon! We've still got some work to do before we can think about trying to replace Excel (like supporting stacked series!), but it's nice to be moving in the right direction and to have achieved this "mini milestone". :)

Any Series can use a CategoryAxis as its independent value axis. Specifically, it is now possible to create a LineSeries with values on the vertical axis and categories (ex: Dogs, Cats, Fish) on the horizontal axis. The purists among you might argue that it's inappropriate to use a LineSeries in this manner because the presence of a line connecting each value suggests a cross-value correlation that's typically not present with categorized data. So the purists are welcome to ignore this feature entirely - but those of you who have requested this feature should please go ahead and make use of it however you feel best fits your particular scenario. :)

Added DependentValuePath and IndependentValuePath string-typed properties to the Series classes (and a corresponding SizeValuePath property to BubbleSeries) to significantly simplify the experience of binding to properties of the underlying data objects being visualized. Instead of having to type something like DependentValueBinding="{Binding Value}", it's now also possible to use the simpler, easier to read DependentValuePath="Value". In fact, we like the simplicity of the new form so much that we've made the new *Path properties the default user-visible properties at design time! The *Binding properties are still present, of course, and can be used for more advanced scenarios such as those where it's necessary to use the Converter parameter of the Binding. The continued support of the *Binding properties also means that any existing code using the Charting core will continue to work just fine as-is and won't need to be changed.

Numerous design-time enhancements for Silverlight 3 and Blend 3. The most obvious improvement here is that dragging a new Chart onto the design surface automatically creates some simple sample data as well as a ColumnSeries that's properly hooked up to that data. This means that not only does the new chart look like a chart (instead of being mostly blank), but it also demonstrates how to correctly hook a Series up to a data source. It's like getting a mini Charting tutorial for free! :) Another big improvement in this area is better exception handling during design-time so the code is less likely to throw exceptions during the intermediate configuration steps that are common to interactive design. This makes it easier to build a chart interactively without having it complain about missing values along the way. Other design-time improvements include improved metadata and a slightly improved workflow.

Added support for Silverlight 3's new easing feature for better control over how data change animations behave. Available only with Silverlight 3 Charting, the new TransitionEasingFunction property of Series makes it easy to select any of Silverlight 3's easing functions to be used when animating the value change of the data points in a Chart. The default value, QuadraticEase, provides a smoother, more pleasing animation that helps keep the viewer focused on the data itself. And while we haven't explicitly changed the DataPoint default fade in/fade out show/hide transition behavior to use an easing function, it's easy for anyone else to do so by providing a custom DataPoint Template in the usual manner.

Added ExtendRangeToOrigin and Origin properties to LinearAxis to enable more scenarios when this axis is used for dependent values. The ExtendRangeToOrigin property is handy when you know you want to display the origin (0) on the dependent axis, but you don't want to have to set Minimum or Maximum because your data could have positive or negative values - or both! Setting ExtendRangeToOrigin is an easy way to ensure that a ColumnSeries or BarSeries always displays the full extent of its columns/bars which makes it easy for the viewer to draw conclusions based on the relative sizes of the elements. Similarly, the Origin property allows you to override the default origin for scenarios where 0 just isn't good enough.

Changed the underlying types of the Chart's Series and Axis properties to improve the code- and design-time experience when using them. As a result, Blend now automatically filters its class list and offers only valid types when adding a new item to either of these collections.

Fixed a memory leak that could occur when a Chart was removed from the visual tree and had one or more Series with their ItemsSource properties set to an ObservableCollection(T) owned by the application. The specifics of the leak scenario are a bit technical, so I'll refer interested readers to this post of mine which contains a fairly detailed description of the problem and its solution.

Changed the default Template of ScatterDataPoint to improve performance and provide more consistent behavior. The previous ScatterDataPoint Template employed a RotateTransform to create its diamond shape - in this release we've switched to a Path which enables us to simplify the Template reduce the ScatterDataPoint's overhead just a bit.

Various architectural changes to improve the current and future programmability story for Charting. Most of these changes aren't the kinds of things that you'll notice as a user, but they're part of our ongoing effort to open up the Charting platform and provide a solid foundation for others to build upon.

Breaking Changes

Assembly name changed to System.Windows.Controls.DataVisualization.Toolkit.dll as part of a Toolkit-wide assembly renaming task. Because this change wasn't specific to Charting, I won't discuss it here. Please refer to the Toolkit release notes for more information about the renaming and how to easily migrate your applications.

Root namespace changed to System.Windows.Controls.DataVisualization as part of a Toolkit-wide namespace renaming task. As above, this change had wasn't specific to Charting and will not be discussed here.

Switched AxisOrientation enumeration values from Horizontal/Vertical to X/Y for clarity, succinctness, and future-proofing. As part of the architectural work that went on, we realized that we'd eventually be switching to X/Y as we introduced certain other features and decided to make the change now to help ease the transition later.

Some of the *Axis properties on the Series classes have been renamed to be more general as a consequence of adding more flexible axis support to the Series classes. For example, what used to be named IndependentRangeAxis is now simply IndependentAxis.

Data values represented by strings are no longer automatically converted to numbers or dates. This is another consequence of the more flexible axis support: when a chart is taking advantage of automatic axis creation, we can't be sure what the desired behavior is if the values "2007", "2008", "2009" are provided as the independent values. Specifically, it's unclear whether the intent is to create a CategoryAxis with three string categories or to create a LinearAxis spanning those numeric values. So we've resolved the ambiguity by requiring stronger typing of dependent and independent values: numeric values must be a numeric type (int, double, etc.) and chronological values must be a DateTime. Otherwise, category values will be used where possible. It's unfortunate that this change may break some existing scenarios, but we believe the ambiguity it removes is worthwhile and the overall behavior is now more consistent and predictable. Charting has always encouraged you to be in charge of your data and this change simply reinforces that - if you want to visualize numbers, then you need to provide numbers. :)

The default Template of Chart has been reworked slightly to make things a bit easier for designers to customize. The most obvious change is the introduction of a new EdgePanel primitive for sizing/positioning the plot area and axes. Using EdgePanel makes this axis placement process more transparent to the designer and should be a little more resilient than the previous Grid-based approach.

Legend is now a TemplatePart of Chart; its LegendItems property has been removed. Certain architectural changes made it necessary for the Chart to be able to identify its Legend and that meant that we needed to formalize things a bit and make Legend a TemplatePart. There's a slight loss of generality here because it is no longer possible to put two or more Legends in the same Template, but as far as we know, nobody was doing this anyway. Note that it is still perfectly acceptable to omit the Legend entirely; TemplateParts are always optional in a Template.

Removed the MarkerWidth/MarkerHeight properties for LineSeries and ScatterSeries. We use the term "convenience properties" for properties that exist to make things easier for the user but that aren't actually necessary because there are other ways of doing the same thing. During development we're always trying to balance the benefits of convenience properties against the API bloat and possible confusion they can cause. In this case, we decided the MarkerWidth and MarkerHeight properties added very little value over re-Templating LineDataPoint or ScatterDataPoint (which is the default approach for changing the appearance of something in WPF and Silverlight). So the default width and height for these DataPoints are now set by their default Templates - and can be customized by re-Templating in the usual manner.

The DataPointSeries and DataPoint classes have been changed to internal visibility to indicate that we are not yet ready for people to be deriving from them when writing their own Series. That's not to say we don't love to see people opening up the hierarchy and writing their own DataPointSeries subclasses - just that we want to be sure people realize that doing so isn't supported quite yet. (But if you do this anyway, please share your feedback with us - we'd like to ensure that when we do open things up they'll work as smoothly as possible!)

Other Changes

Various UI improvements and bug fixes for issues reported by customers or found internally.

There's lots of good stuff here - we hope you'll enjoy using it as much as we enjoyed developing it!


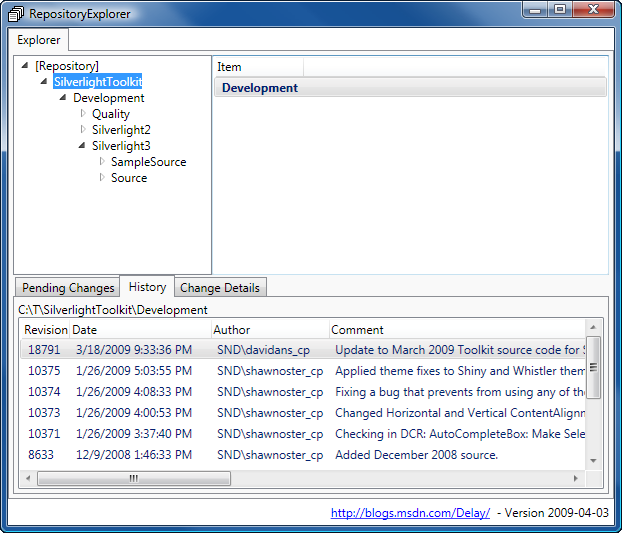
Please click here to download the complete Silverlight 2 and Silverlight 3 source code for a project demonstrating all of the sample charts shown below (and by my two previous introductory blog posts on Charting).


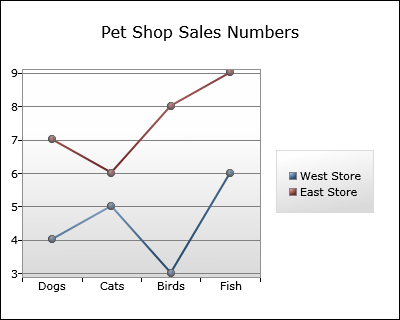
Let's begin by looking at an example of the new support for using a CategoryAxis somewhere that it previously wouldn't have been allowed. For this example, we'll look at a fictitious pet shop chain's sales numbers for four types of animals across two different stores. We could go the traditional route and use ColumnSeries for this, but in this case we're looking to visually draw attention to the fact that one store is outselling the other in every category. With the latest Charting bits, it's easy to do this with LineSeries:

LineSeries on a CategoryAxis

Here's the XAML for this chart:

<!-- Chart with shared DataContext -->
<chartingToolkit:Chart
    Title="Pet Shop Sales Numbers"
    DataContext="{StaticResource SalesDataCollection}">
    <!-- West Store data -->
    <chartingToolkit:LineSeries
        Title="West Store"
        ItemsSource="{Binding}"
        IndependentValuePath="Animal"
        DependentValuePath="WestStoreQuantity"/>
    <!-- East Store data -->
    <chartingToolkit:LineSeries
        Title="East Store"
        ItemsSource="{Binding}"
        IndependentValuePath="Animal"
        DependentValuePath="EastStoreQuantity"/>
</chartingToolkit:Chart>

Because the "Animal" property of our data objects is of type string, the LineSeries automatically does what we want and uses a CategoryAxis for the horizontal axis! Note that we're also using the new *Path properties to specify the independent/dependent values instead of the *Binding properties. The new syntax is short, sweet, and to the point - and allows us to focus on visualizing our data instead of creating Bindings.

One other thing worth calling attention to here is the way the data source is associated with both Series. In this case (as in many real-world scenarios), a single data source provides data objects for multiple series. While we could certainly recreate the same Binding to that data source in the ItemsSource property of each Series, there's a slightly easier way! What we do instead is specify the data source as the DataContext of the Chart object and then simply point both ItemsSource properties to it via a simple "{Binding}". The savings in this particular example are relatively minor, but for scenarios with more series, the convenience of being able to perform the actual binding to the data source in just one place becomes quite nice.


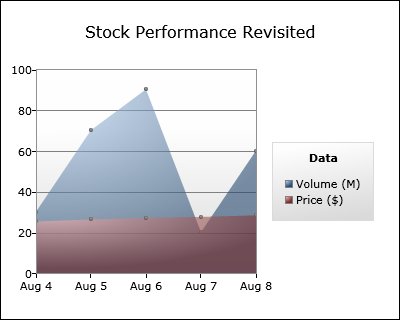
For the next example, let's revisit one of the charts from last time that used BubbleSeries to visualize the performance of a made-up stock ticker by displaying its price and volume by date. But this time around we'll use two instances of the new AreaSeries class to display the same data. Here's how it looks:

AreaSeries

The XAML is very similar to last time:

<chartingToolkit:Chart
    Title="Stock Performance Revisited"
    LegendTitle="Data">
    <!-- Volume -->
    <chartingToolkit:AreaSeries
        Title="Volume (M)"
        ItemsSource="{StaticResource StockDataCollection}"
        IndependentValuePath="Date"
        DependentValuePath="Volume"/>
    <!-- Price -->
    <chartingToolkit:AreaSeries
        Title="Price ($)"
        ItemsSource="{StaticResource StockDataCollection}"
        IndependentValuePath="Date"
        DependentValuePath="Price"/>
    <chartingToolkit:Chart.Axes>
        <!-- Axis for custom range -->
        <chartingToolkit:LinearAxis
            Orientation="Y"
            Minimum="0"
            Maximum="100"
            ShowGridLines="True"/>
        <!-- Axis for custom labels -->
        <chartingToolkit:DateTimeAxis
            Orientation="X">
            <chartingToolkit:DateTimeAxis.AxisLabelStyle>
                <Style TargetType="chartingToolkit:DateTimeAxisLabel">
                    <Setter Property="StringFormat" Value="{}{0:MMM d}"/>
                </Style>
            </chartingToolkit:DateTimeAxis.AxisLabelStyle>
        </chartingToolkit:DateTimeAxis>
    </chartingToolkit:Chart.Axes>
</chartingToolkit:Chart>

Notice how the semi-transparency of the fill used by AreaSeries makes it easy to plot both sets of data on the same chart. We've also gone ahead and added a title for the Legend via the LegendTitle property on Chart and customized the names of each series via the Title property on Series. We're using the simplified *Path syntax again to keep things easy to understand and we've preserve the previous sample's axis customization to provide a nicely readable representation of the dates being displayed (instead of the longer MM/DD/YYYY form that's used by default).


For the last example, we'll need to use the Silverlight 3 version of Charting because we're going to take advantage of the new support for easing functions that's available there. The effort needed to customize the easing function used by a Series is practically nothing - all you need to do is add the highlighted portion below to an existing chart and you're done! It really is this easy:

<chartingToolkit:Chart
    x:Name="EasingDemonstration"
    Title="Easing Demonstration">
    <chartingToolkit:ColumnSeries
        Title="Gelatin Sales">
        <!-- Custom easing function -->
        <chartingToolkit:ColumnSeries.TransitionEasingFunction>
            <ElasticEase EasingMode="EaseOut"/>
        </chartingToolkit:ColumnSeries.TransitionEasingFunction>
        <!-- Specify an appropriate color -->
        <chartingToolkit:ColumnSeries.DataPointStyle>
            <Style TargetType="Control">
                <Setter Property="Background" Value="#ff33ff33"/>
            </Style>
        </chartingToolkit:ColumnSeries.DataPointStyle>
    </chartingToolkit:ColumnSeries>
    <!-- Custom Y axis for range -->
    <chartingToolkit:Chart.Axes>
        <chartingToolkit:LinearAxis
            Orientation="Y"
            Minimum="0"
            Maximum="10"
            ShowGridLines="True"/>
    </chartingToolkit:Chart.Axes>
</chartingToolkit:Chart>

Here's what the corresponding chart looks like:

EasingFunction

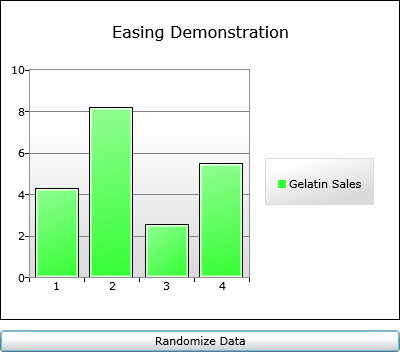
Okay, I admit: this is just a static picture and the effect of the easing function can't be appreciated here... However, if you download and build the Silverlight 3 version of the sample code linked to above, you'll find that clicking the "Randomize Data" button changes the data values every time it's pressed. And every time it does, the ElasticEase function specified above causes each of the bars to zoom quickly to their new values and then bounce around for a bit - just as if the bars were made out of gelatin! I'll grant that ElasticEase is probably not the most practical easing function for data visualization purposes, but we found that the default QuadraticEase behavior makes a very noticeable - yet subtle - impact on the viewer. It obviously won't turn a bad chart into a good chart, but it adds just a bit of extra polish that can help a good chart really shine! :)


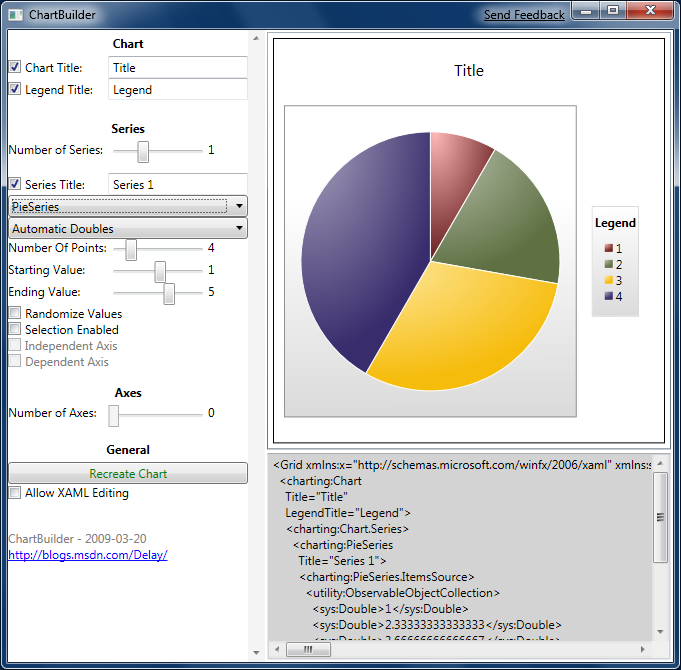
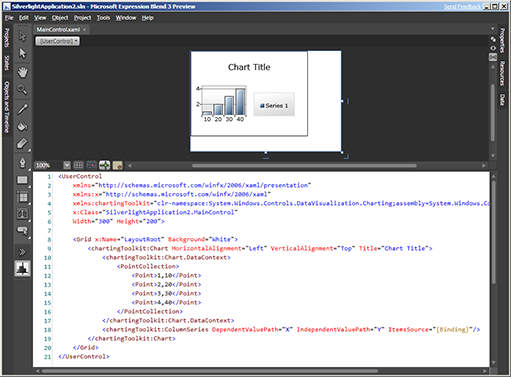
Finally, let's have a look at one of the many Blend improvements we've made in this release. One of the things we wanted to do was help newcomers to Charting get up and running as quickly as possible without having to learn a lot of obscure concepts. To that end, when you drop a new Silverlight 3 Chart onto the design surface with the new Blend 3 Preview, you'll automatically get not just XAML for the chart, but also a bit of sample data and a properly configured ColumnSeries that uses it to display a very simple chart!

Blend 3 Charting User Experience

Of course, we don't expect this to be the same data you intended to visualize, but the automatic creation and configuration of the complete end-to-end scenario should help people understand just what it takes to create a chart. Furthermore, it's easy to begin experimenting with the objects and data that are automatically created in order to learn more and develop an understanding about how the different properties work together. To make that experimentation even more rewarding (translation: less frustrating) we've done some work internally to suppress many of the exceptions that result from the invalid configurations that are so easy to accidentally trigger when interactively manipulating a chart in the designer. There's still a lot more that can be done to improve the design-time experience for Charting - but I hope you'll agree that changes like this move us strongly in the right direction!


We've had a great time working on the March 09 release of Charting and hope you're as excited by the new functionality as we are! You can always browse the live Charting sample page for Silverlight 2 or Silverlight 3 to find out more - then please download the March 09 Toolkit release - for Silverlight 2 or Silverlight 3 - and start playing around with the new stuff! And as always, if you have questions about Charting, please ask them in the Silverlight Controls forum where there are plenty of folks who are happy to help out (including us!). If you run into problems and think you've found a bug, please report it with the Issue Tracker on the Toolkit's CodePlex site so that we'll know about it and others can tell us if they're seeing the same behavior.

Thank you very much for taking an interest in Charting - I hope you have fun with the new bits!! :)


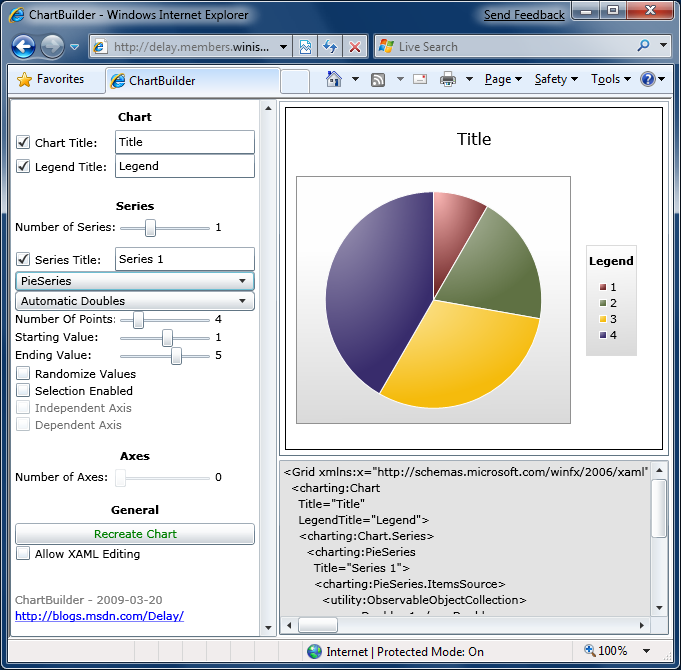
PS - I'll be posting an update to my ChartBuilder application/tutorial (Background reading: Introduction, Update, New Release) in the next day or so. ChartBuilder itself hasn't changed much since last time, but there's going to be something special about it this time that think you'll agree is pretty exciting! :)