My new home page, revised [Updated collection of great Silverlight/WPF Data Visualization resources!]
In the time since sharing my last collection of Silverlight/WPF Charting links, there have been some great new articles I'd like to highlight. And in case you haven't heard, we published the October 09 release of the Silverlight Toolkit last week, so please consider upgrading if you haven't already!
Here are the latest links (FYI: previously published links are gray):
Overviews (100 level)
- Silverlight Toolkit Released – More controls! - Tim Heuer's during the PDC keynote overview set the stage for good Charting content.
- Silverlight Toolkit (Silverlight 2 Control Pack) - Charting - Pete Brown followed up minutes later with another good overview. (Party trivia: The styles seen in his blog offer a rare glimpse of the pre-release Charting styles.)
- Silverlight - Introducing the Chart Control - Chad Campbell was also ready with a good "zero-day" overview and code samples.
- The Weekly Source Code 36 - PDC, BabySmash and Silverlight Charting - Scott Hanselman's post includes a BabySmash tie-in and a smidge of flattery. :)
- Graphing – Silverlight Toolkit - Jesse Liberty introduces Charting and covers some of the basics.
- Bubble chart - Jesse Liberty introduces the BubbleSeries class and describes some interesting use-cases.
- The Bubble Chart in the Silverlight Toolkit - Sparkling Client interviews Jesse Liberty in this podcast discussing the BubbleSeries.
- Day #15: Silverlight Charting - Jeff Blankenburg gives a nice overview of Charting and demonstrates how easy it is to switch series types along the way.
Scenarios (200 level)
- Zooming into a chart - Ruurd Boeke did the "zooming" scenario sample for the live Charting samples page - here's how he did it.
- Silverlight - Getting Started with the Chart Control - Chad Campbell again - a thorough walkthrough of creating your first chart.
- Silverlight 2 Custom Stock Charts With Silverlight Toolkit - Peter Bromberg with his own walkthrough - creating a stock chart with plenty of code.
- Styling the Charts in the Silverlight Toolkit - Pete Brown again - this time with a good styling overview for designers.
- Designer’s Guide to Styling Silverlight Toolkit Charting Controls - Mehdi Slaoui Andaloussi goes over the top with a "soup to nuts" designer-oriented guide to styling everything. It probably helps that Mehdi works on my team and authored the shipping styles for Charting as well. :)
- Pie Chart Styling in the Silverlight Toolkit - Cross-Slice Gradients - Pete Brown takes a proof-of-concept for holistic pie chart styling and uses it to great effect.
- Bubbles – 1 Chart – three Axes - Jesse Liberty takes advantage of BubbleSeries to visualize historical data in an interesting way.
- Customizing the Labels on an Axis of the Silverlight Toolkit Chart - Kevin Dockx calls out the AxisLabelStyle property which allows designers to easily customize the labels of an axis.
- Dazzling Silverlight Toolkit Pie Charts with Overlays - Pete Brown continues working with pie charts and creates a further level of polish by adding some shiny overlays that make the visuals "pop".
- Silverlight Charting: Creating rich data point tooltips - Jeff Wilcox shows how he customized the ToolTips of a LineSeries to show a wealth of information relevant information in a very user-friendly manner.
- Pie Chart and Column Chart videos post - Jesse Liberty demonstrates the use of PieSeries and ColumnSeries in a set of "How Do I" videos.
- Styling Charts with the Silverlight Toolkit - Pete Brown's comprehensive Expression Newsletter article provides some of the best information available anywhere about Charting styling!
- Styling a Silverlight Chart - Rudi Grobler shows how to re-style a LineSeries to look just like the Google Analytics charts.
- LineChart with Markers - Lee demonstrates one way of adding markers (also known as annotations or cursors) to a Chart.
- Showing and Hiding Series in chart - Lee neatly solves the problem of hiding (and showing) individual Series by clicking on their entries in the Legend.
- Creating, Binding and Styling a Bubble Chart - Timmy Kokke shows off how some of the new Blend 3 features can be used to completely customize the appearance of a BubbleSeries without writing any code at all.
- Custom Bar Charts with the Silverlight Toolkit - Pete Brown discusses how he went about dramatically customizing the appearance of two Chart types to create a very modern, polished look for a demo app.
- Silverlight 3: Displaying and Charting with TwitterCounter - Peter Bromberg shows off an application to display Twitter statistics along with a chart of followers over time.
- Silverlight - Drill Down Charts Walkthrough - Chad Campbell gives a great overview of creating "drill-down" charts - in video form!
Internals (300 level)
- Adding a Location Crosshair to Silverlight Charts - Colin Eberhardt shows how to add crosshairs on top of a Chart to display the coordinates of the mouse pointer.
- Adding a Location Crosshair to Silverlight charts (again!) - Colin Eberhardt updates his crosshairs post to accommodate changes in the March 09 release.
- How to create stock charts using the Silverlight Toolkit - Rudi Grobler shows how to create a custom Series type that's perfect for stock charts (open/high/low/close).
- Silverlight Charts: Binding multiple Series - Jeremiah Morrill shows off an attached behavior that enables binding a Chart to a "collection of collections" to create an arbitrary number of series automatically.
- Interacting with Charts - Lee implements a nice interactive range selection behavior to create a friendly "zoom" feature for controlling the Axis range.
- Interacting with charts-2 - Lee shows off a proof-of-concept implementation to add an overlay for the plot area with grippers that enable interactive zooming on an axis.
- How can I add labels to a WPF pie chart? - Bea Stollnitz begins her three-part series about adding annotations to a pie chart with an overview.
- How can I add labels to a WPF pie chart? - Implementation details - Bea Stollnitz's second post explains how she implemented her pie chart annotations on WPF.
- How can I port the WPF labeled pie chart to Silverlight? - Bea Stollnitz's final post of the trilogy details how she ported the WPF implementation to Silverlight.
- Freeing the axes of the Microsoft toolkit charting control - Robert provides an in-depth description of how he created a custom axis behavior and used it to produce a nice stacked chart display.
- WPF & Silverlight Charting: A Logarithmic Axis - Cory Plotts took it upon himself to write - and share - a LogarithmicAxis implementation that should make some of you very happy!
Team Member posts (Partner level)
- Building an Observable Model in Silverlight - Jafar Husain gives some deep, technical detail about the observable model that Charting uses to enable its rich dynamic data support.
- Writing Your Own Silverlight Chart Series (Part 1): Making Designers Happy - Jafar Husain provides an overview of what it takes to create a new Series type and some scaffolding for an OHLC Series.
- Writing Your Own Silverlight Chart Series (Part 2): Implementing the Series - Jafar Husain explains all that it takes to completely implement a custom chart type using only the public interfaces!
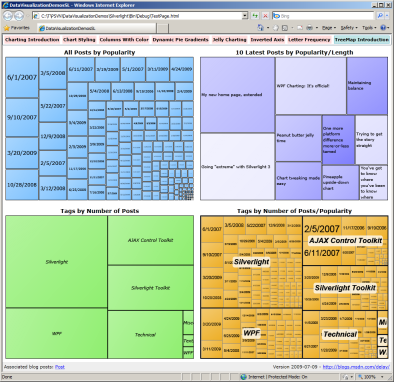
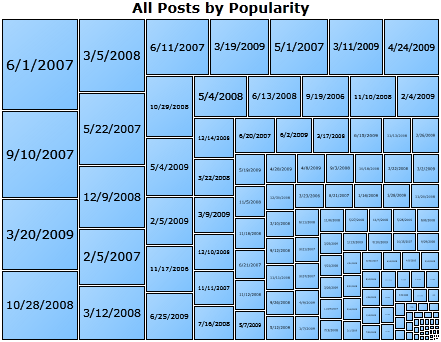
- TreeMap control is coming to Silverlight Toolkit - Marek Latuskiewicz introduces the new TreeMap control, explains what Interpolators are, and shows how they work.
- Treemap released in Silverlight Toolkit - Gareth Bradshaw gives a great TreeMap overview that touches on all the common scenarios.
- TreeMap in Silverlight Toolkit: How to write your own interpolator - Marek Latuskiewicz explains more about what Interpolators are, how they're actually used by the TreeMap control, and how to write one yourself!
My posts (Ego level)
- Announcing a free, open source Charting solution for Silverlight [Silverlight Toolkit released today at PDC!]
- Click your way to great Silverlight charts [Live ChartBuilder sample and source code!]
- Improving ChartBuilder's cultural sensitivity [ChartBuilder app/source updated!]
- Silverlight Charting gets a host of improvements [Silverlight Toolkit December 08 release now available!]
- Great Silverlight charts are still just a click away [ChartBuilder sample and source code updated for Charting's December 08 release]
- Yummier pies! [A technique for more flexible gradient styling of Silverlight Toolkit pie charts]
- Columns of a different color [Customizing the appearance of Silverlight charts with re-templating and MVVM]
- Silverlight Charting is faster and better than ever [Silverlight Toolkit March 09 release now available!]
- Silverlight Charting remains just a click away - and runs on WPF, too!! [ChartBuilder sample and source code updated for Charting's March 09 release]
- Supporting the unsupported [Two fixes for the unofficial WPF Charting assembly!]
- If they can build it, they will come... [Enabling anyone to compile WPF Charting from the Silverlight Charting sources!]
- Another round of (un)support [Quick fix for the unofficial WPF Charting assembly!]
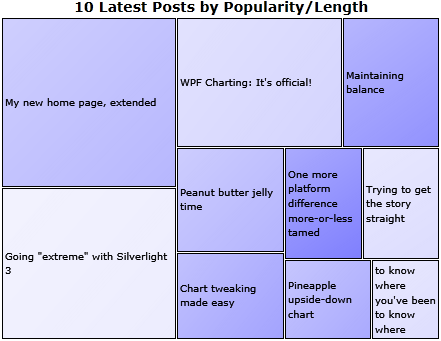
- Pineapple upside-down chart [How to: Invert the axis of a chart for "smaller is better" scenarios]
- Chart tweaking made easy [How to: Make four simple color/ToolTip changes with Silverlight/WPF Charting]
- Peanut butter jelly time [How to: Create a pleasing visual effect with Silverlight/WPF Charting]
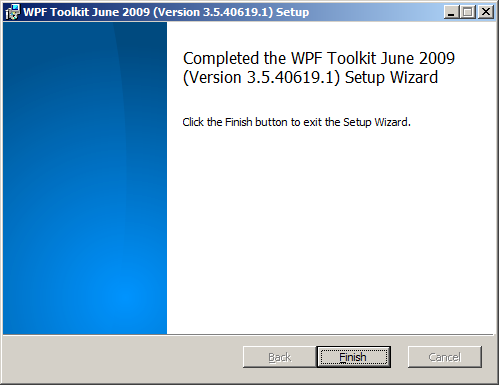
- WPF Charting: It's official! [June 2009 release of the WPF Toolkit is now available!]
- Silverlight Charting gets an update - and a TreeMap! [Silverlight Toolkit July 2009 release now available!]
- Bringing the Silverlight Toolkit's TreeMap to WPF [Silverlight/WPF Data Visualization Development Release 0]
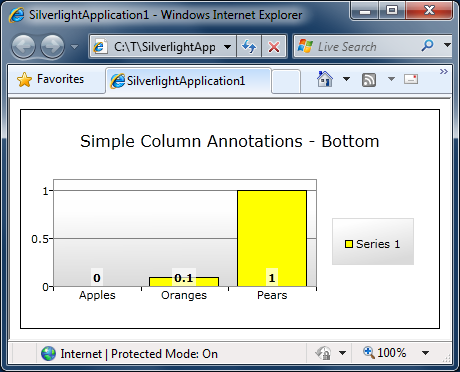
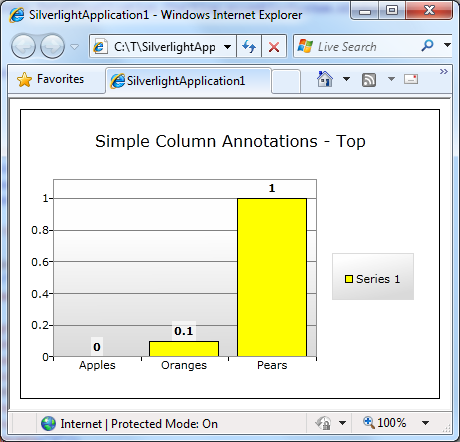
- Simple column labels you can create at home! [Re-Templating the Silverlight/WPF Data Visualization ColumnDataPoint to add annotations]
- A preview of upcoming Charting changes [Silverlight/WPF Data Visualization Development Release 1]
- Silverlight (and WPF) Data Visualization classes unsealed [Silverlight Toolkit October 2009 release now available!]
- Two birds, one stone [Silverlight/WPF Data Visualization Development Release 2 and DataVisualizationDemos update]
Many, many thanks to everyone who's spent time helping others learn how to use Silverlight/WPF Data Visualization!
PS - If I've missed any good resources, please leave a comment with a link - I'm always happy to find more good stuff!
PPS - The most recent version of this collection will always be pointed to by http://cesso.org/r/DVLinks. If you're going to link to this post, please use that URL so you'll always be up to date.