Simple column labels you can create at home! [Re-Templating the Silverlight/WPF Data Visualization ColumnDataPoint to add annotations]
A customer contacted me over the weekend asking how to add labels (also known as annotations) to a ColumnSeries. My reply was that we don't support annotations in Silverlight/WPF Charting yet, but it's possible to create some pretty simple ones for limited scenarios just by editing the default ColumnDataPoint Template. And because it's so quick, I thought I'd write up a brief example on the bus!
Aside: For some more examples of basicDataPointTemplatechanges, please have a look at my earlier post on customizing ToolTips.
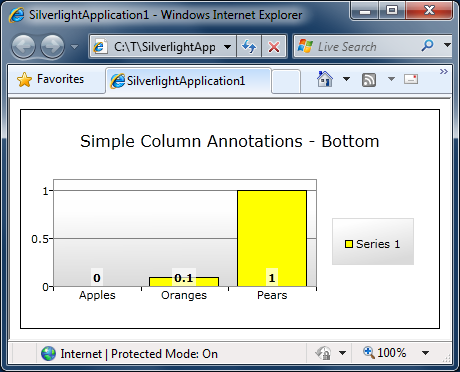
In this case, the customer wanted to add a label showing the column's value at the bottom of the column, just above its axis label. (This is a nice place to put labels because it makes it easy for viewers to associate the category with its value no matter how high each column is.) The obvious approach is to add a TextBlock to the body of the default Template, but the problem with that is that the text can get clipped or even disappear for small columns... So the trick is to add a negative Margin to pull the text "outside" the normal clipping region. Fortune must have been smiling upon me, because when I tried this on Silverlight, it worked just like I wanted!
Aside: My other idea was to use a Canvas because it doesn't clip by default; maybe someone else will need to use that approach for their scenario.
Here's how the resulting chart looks:
The XAML's nothing special - aside from the negative Margin, it's all standard stuff:
<charting:Chart
    Title="Simple Column Annotations - Bottom">
    <charting:ColumnSeries
        DependentValuePath="Value"
        IndependentValuePath="Key"
        ItemsSource="{Binding}">
        <charting:ColumnSeries.DataPointStyle>
            <Style TargetType="charting:ColumnDataPoint">
                <Setter Property="Background" Value="Yellow"/>
                <Setter Property="Template">
                    <Setter.Value>
                        <ControlTemplate TargetType="charting:ColumnDataPoint">
                            <Grid>
                                <Rectangle
                                    Fill="{TemplateBinding Background}"
                                    Stroke="Black"/>
                                <Grid
                                    Background="#aaffffff"
                                    Margin="0 -20 0 0"
                                    HorizontalAlignment="Center"
                                    VerticalAlignment="Bottom">
                                    <TextBlock
                                        Text="{TemplateBinding FormattedDependentValue}"
                                        FontWeight="Bold"
                                        Margin="2"/>
                                </Grid>
                            </Grid>
                        </ControlTemplate>
                    </Setter.Value>
                </Setter>
            </Style>
        </charting:ColumnSeries.DataPointStyle>
    </charting:ColumnSeries>
</charting:Chart>
Just for fun, I thought I'd try the same trick to put the annotations on top of the columns, too. This is the more traditional location - and that also works pretty nicely:
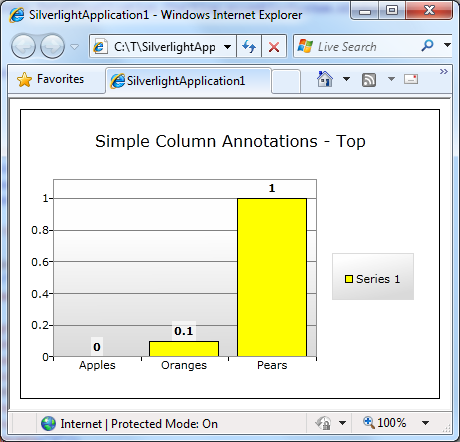
The only change from the previous XAML is switching the VerticalAlignment to Top:
<Grid
    Background="#aaffffff"
    Margin="0 -20 0 0"
    HorizontalAlignment="Center"
    VerticalAlignment="Top">
    <TextBlock
        Text="{TemplateBinding FormattedDependentValue}"
        FontWeight="Bold"
        Margin="2"/>
</Grid>
And there you have it - a simple technique for simple column annotations!
Aside: Of course, these aren't "real" annotations - they'll eventually break in more complicated scenarios. But hey, if you've got simple needs, here's a simple solution for you.:)
PS - For people playing along at home, here's how I created the data for the samples:
public MainPage()
{
    InitializeComponent();
    var items = new List<KeyValuePair<string, double>>();
    items.Add(new KeyValuePair<string,double>("Apples", 0));
    items.Add(new KeyValuePair<string,double>("Oranges", 0.1));
    items.Add(new KeyValuePair<string,double>("Pears", 1));
    DataContext = items;
}