The one with all the goofy heading names [Detailed information about the Silverlight Toolkit's new stacked series support]
Yesterday's publication of the April '10 release of the Silverlight Toolkit includes a bunch of new functionality. If you haven't read my release notes post, now might be a good time to do so...
Okay, thanks.
Motivation
Some of the top customer requests for Silverlight/WPF Data Visualization have been:
- Stacked series
- Better performance
- A pony
This release of the Toolkit delivers on two of those. (Sorry, you're going to have to wait a little while longer for the pony.)
Implementation
The primary goal for Data Visualization in this release of the Toolkit was to implement support for stacked series. I started out by looking at ways of adding that functionality to the existing series hierarchy (based on the DataPointSeries base class). There were two options that seemed interesting, so I played around with each for a bit. But while both definitely seemed viable, neither felt completely right to me. I was also very concerned about accidentally breaking existing scenarios with the addition of the new stacking code (i.e., primum non nocere). At the same time, I'd become curious about the merits of an alternate implementation we'd talked about a couple of times...
So I experimented with merging all the ideas by implementing stacking support with a new, distinct series hierarchy and building everything up from the ISeries interface. While this would obviously create more work in some respects (duplicating portions of existing functionality), it also meant that I could factor everything I learned from working with the original hierarchy into the new design. Along the way, I kept to a strict rule: no modifications to existing Charting code beyond necessary bug fixes (and there were only one or two of these). With this approach, I could be fairly confident about minimizing the risk to existing applications and scenarios. And besides, the fact that it's so easy to do is a great example of Charting's flexible extensibility model!
As a result, the new stacked series hierarchy is completely compatible with the original series hierarchy and all of the existing Chart/Axis/DataPoint/etc. infrastructure. (Although it doesn't usually make a lot of sense, you can even mix both hierarchies in the same chart!) The original hierarchy was fairly DataPoint-centric: everything revolved around DataPoint instances, their management, their display, etc.. Consequently, the base class of the original series hierarchy was named DataPointSeries. Now, while the new hierarchy also manages DataPoints, the heart of it is centered around definitions of each series (much like how the Grid class uses definitions to describe its layout). Therefore, the base class of the new hierarchy is named DefinitionSeries for consistency with the original hierarchy as well as the naming conventions used elsewhere by Charting. The definitions that control this new hierarchy are put inside an instance of the DefinitionSeries class to define individual series. The definition class is therefore named SeriesDefinition (in keeping with the same naming pattern and akin to Grid's RowDefinition).
If you've been paying close attention so far (or perhaps really if you haven't), you see that a DefinitionSeries contains SeriesDefinitions and might wonder "Golly, won't that naming juxtaposition be confusing?". Well, it's actually pretty easy to keep straight if you remember the naming pattern is DistinguishingCharacteristic+TypeName. DefinitionSeries class directly - it's an abstract base class and can't be instantiated in XAML. What people will end up using are one of the eight new series types, all of which are fairly unambiguously named:
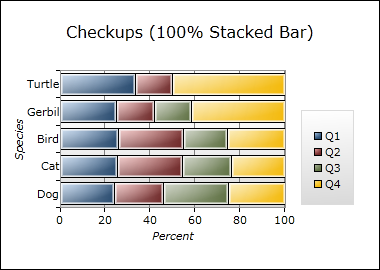
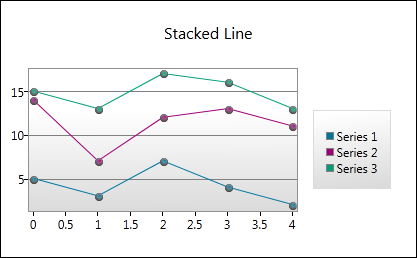
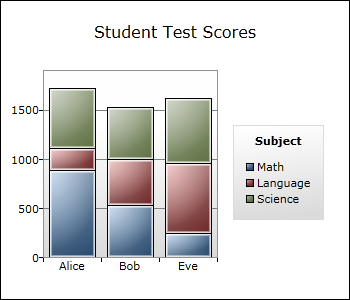
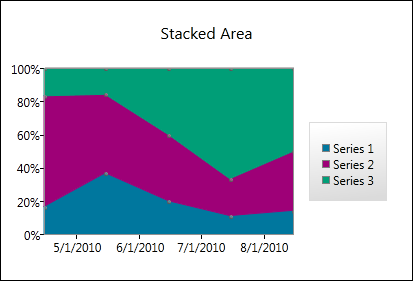
StackedBarSeriesStackedColumnSeriesStackedLineSeriesStackedAreaSeriesStacked100BarSeriesStacked100ColumnSeriesStacked100LineSeriesStacked100AreaSeries
The first four classes listed above are "normal" stacked implementations of a bar/column/line/area series; the last four types are their "100%" stacked variants. "Normal" stacked series render based on the actual values of the data involved (ex: 10, 3.25, 712) whereas the 100% stacked series display the dependent values as percentages of the whole (kind of like how pie charts work - everything always adds up to 100%).
Supplication
The first hierarchy was based on series instances which worked together at times (in the case of multiple column and bar series). The new hierarchy is based on a single instance coordinating an arbitrary number of constituent series definitions. Why the difference? Coordination. Where stacked series are concerned, data points from one member series have a very strong dependence - and effect - on the positions of points in the other series. While it would certainly be possible to coordinate this effort in the original model (as we do for columns that share the same category slot), there's a distinct lack of a conceptual "owner" and it's also not clear where to put properties that affect the stacked series as an whole (ex: an explicit axis). By creating a single entity to represent the stacked series "group", the answers become obvious. So the question becomes whether it makes sense to have a "simple wrapper with sophisticated children" or a "sophisticated wrapper with simple children". And it seems pretty clear that things will be easier all around if the parent/wrapper class is not just the place where common properties are set, but also where all the logic for managing the stacked series lives.
Inspiration
The original hierarchy was designed with extreme extensibility in mind - and one of the things customers frequently comment on is just how flexible things are and how easy it is to build on top of. But flexibility has its price - one of the other things customers comment on is how they'd like better performance. (And don't forget the pony.) Because the existing hierarchy seemed to have extensibility pretty well covered, what I wanted to do with the new hierarchy was focus on performance. To that end, one of the most significant changes I made is that the stacked series hierarchy keeps itself out of the business of managing the DataPoint lifecycle (something that causes a decent amount of overhead for the old hierarchy). Instead, DefinitionSeries uses an ItemsControl to handle the gory details of container creation, realization, deletion, etc.. What's particularly nice is that this is exactly what ItemsControl is designed and optimized for, so it's a great example of using the right tool for the job.
Another potential bottleneck for the original series stack is that it makes most changes "on demand" - by which I mean that as soon as a value change is detected for the user's data object, that change gets propagated through the entire system. Now, that's a perfectly reasonable approach to take and it nicely ensures everything is always up to date. But it also suffers from a pretty big drawback: when many things are changing at the same time, there's a whole lot of wasted effort. So when the new stacked series hierarchy finds out about a value change, it simply leaves itself a little reminder to update the relevant graphic during the next update pass - and then returns immediately without doing anything else. In the simple scenario of isolated onesey-twosey changes, the net result is about the same amount of work for both series hierarchies - but in scenarios where lots of things are changing at the same time, the new approach turns an ~O(N+) problem into an ~O(1) one because all those cascading, overlapping changes collapse into a single "update everything at once" operation. (Yes, I'm playing fast and loose with big O notation here - the idea is that instead of doing what amounts to the same positioning calculations over and over again, it's done just once.)
Duplication
If you think about it for a bit, it seems obvious that a StackedLineSeries plotting just one series should look more or less identical to a normal LineSeries plotting the same data. So it really ought to be possible to use a stacked series in most of the same places its non-stacked counterpart makes sense. Which would be little more than a superficial parlor trick if there weren't a compelling reason to use the seemingly more complex implementation in the simpler scenario... [Aside: Hold that thought for just a moment.
Even without a compelling functional reason to substitute like this, there's a very good testing reason to switch: suddenly every existing Charting application becomes a test case for the new stacked series hierarchy! If there were an easy way to substitute a stacked series (with its slightly different API) into an existing scenario, this would help identify all kinds of issues with the new hierarchy. (Trust me, I speak from experience.) And that's why I created the System.Windows.Controls.DataVisualization.Charting.Compatible namespace. It contains five classes named ColumnSeries, BarSeries, LineSeries, AreaSeries, and ScatterSeries which are API-wise virtually identical to the original series implementations of the same names, but use the new stacked series code under the hood. Which makes it trivial to substitute them for their non-stacked counterparts.
Aside: Where did a stacked implementation ofScatterSeriescome from? Nowhere, actually - it's just a stackedLineSerieswith an invisible line.:)Which means it suffers from some completely unnecessary overhead because it burns cycles managing a line nobody can see and it has all the overhead of supporting stacking. However, we'll find out in a moment that it can still outperform the original, unburdenedScatterSeriesimplementation!
These "Compatible" classes don't show up in the design tools because I don't want anyone to confuse the two same-named implementations of the same behavior. But if you want to make the switch, all it takes is a trivial XAML/code edit to convert many scenarios over. This conversion can be a tad more involved when there's a lot of code that directly manipulates the base classes of the old hierarchy, but the process is usually quite simple and straightforward. I should know, I performed this conversion for every public Charting sample I've written as part of my testing efforts!
Implication
I've probably way over-done the foreshadowing, so the following revelation isn't likely to surprise anyone: the stacked series hierarchy can be significantly faster than its non-stacked counterpart! Of course, I don't guarantee that every scenario is faster. In fact, I'd be very surprised if that were the case - there are certain aspects of the new implementation that I know to be suboptimal. However, some scenarios are very noticeably faster in practice. To demonstrate that, I've enhanced the "Performance Tweaks" page of my DataVisualizationDemos application (which I'll be releasing a new version of shortly!) to allow the creation of a "Compatible" ScatterSeries. Comparing the two implementations highlights some clear performance wins for the stacked hierarchy: configurations that bog down the system when using the original series hierarchy are reasonably snappy with the stacked one. Looking at it from the opposite direction, this means it can be possible to get the same level of performance with more points on the screen simply by switching to the new hierarchy.
Another interesting side effect of having a parallel implementation is that the two are not likely to have the same bugs. Specifically, there are some scenarios I know to be problematic with the original series implementation that literally "just work" when converted to the new implementation. I've already seen this happen in practice with two different customer apps - I was able to work around a problematic behavior in the original stack simply by switching to the new stack. Of course, no code is perfect - and as much as I've tried to find all the bugs in the new code, there are certain to be problems I don't know about yet. So this duality is hardly a panacea. That said, it's a nice trick to have in your back pocket for those times where it is relevant and can save you a bunch of time debugging something you didn't have to!
Enumeration
The new hierarchy looks and behaves basically the same as the old hierarchy in most respects - and all the concepts people are used to dealing with still apply. API-wise, nearly all the same properties are still available and do the same thing they've always done - they're just split across the DefinitionSeries classes and SeriesDefinition according to where they make the most sense. Though there is one deliberate omission and a few details have changed just a bit. Here's the scoop:
- Setting
DependentValuePathorDependentValueBindingis now required (the former is the simple form that takes a property name to use as the path of a Binding; the latter is the advanced form that takes a fullBindingwhich may be specifically customized by the developer). Similarly, settingIndependentValuePathorIndependentValueBindingis now also required. We'd originally thought it would be nice for users if we avoided the need to set these properties, but some people ended up confused anyway. Because supporting that behavior also complicated the implementation, the stacked series hierarchy doesn't try to be clever here. One of each pair must be set. Always. - On a very related note, the exception type and message that result when the Binding/Path properties aren't set is not always as clear as it could be with the original series hierarchy. But because of the new hierarchy's stricter requirements, it's possible for to give a very relevant, specific error message in these cases.
- I mentioned that there's a single property that's absent from the new hierarchy:
AnimationSequence. While the original idea of making it easy for users to stagger the show/hide transitions of theDataPoints seemed cool, very few people seemed to use this feature in practice. And like above, this feature required a non-trivial amount of rather involved code that occasionally tripped people up or caused problems. Therefore,AnimationSequenceis not available on the stacked series classes. - The base class of
Legendwas changed to HeaderedItemsControl in the previous Toolkit release, but theTitleproperty wasn't removed in order to avoid breaking existing templates. Unfortunately, that leftLegendwith two different properties corresponding to the same thing:Titleand Header (the latter coming fromHeaderedItemsControl). While I think "Title" is a better name for what the properties mean forLegend, the duplication required synchronizing their contents and there were situations where this introduced problems. Therefore,Legend'sTitleproperty has been removed and all relevant templates have been updated to refer to theHeaderproperty. - It used to be that attempts to customize the
Legend's Visibility property via theChart.LegendStylewere ineffectual. Regrettably,Legenditself stomped on its ownVisibilityproperty as part of its attempt to hide when it had no content to display. That annoying behavior has been corrected in this release and it's now possible to hide theLegendby setting itsVisibilitytoCollapsedwith theLegendStyleproperty. - While doing performance measurements for the stacked series hierarchy, I discovered some unfortunate inefficiencies in the axis stack. The relevant code has been tuned for this release and the resulting performance improvements will be visible to all series implementations.
- The color of the line/area graphic for the original
LineSeriesandAreaSeriesis derived from the Background of the effectiveDataPointStylefor the series. This makes sense and can be convenient - but it can also be confusing when users set thePolylineStyleorPathStyleproperties, too. And because these two properties couldn't previously be set in thePaletteof aChart, the designer story wasn't as good as it could have been here. Therefore, I've added aDataShapeStyleproperty to the stacked series hierarchy which can be used just likeDataPointStyleand is also fetched from the relevant ResourceDictionary palette entry. Similarly, I've addedDataShapeStyleentries to the defaultPaletteentries so the appearance of the stacked series classes should be more obvious and more readily customized. - I mentioned above that
DefinitionSeriesusesItemsControlfor all its point management - but that's not quite true... It really uses ListBox, and becauseListBoxsupports single- and multi-select modes, it was rather easy to plumb that support through toDefinitionSeriesas well. Therefore, instead of exposing anIsSelectionEnabledproperty like the original series classes do, the stacked series classes expose aSelectionModesproperty which can be set toNone,Single, orMultiple. The corresponding read/write propertiesSelectedIndex,SelectedItem,SelectedItems, and theSelectionChangedevent (a true RoutedEvent on WPF) are also available and behave just like they do forListBox. - In one of those rare cases where the default behavior "just makes sense", the result of using the "Compatible"
ColumnSeriesorBarSeriesto display a series with one or more items that share the same independent value is that the columns with shared values stack with each other. If that seems obvious to you, I agree!:) What's interesting is that we spent a decent amount of time discussing what *should* happen during the implementation of the originalColumnSeriesbefore settling on the current "staggered" behavior. (There's an example of this near the middle of this post.) And while I still think staggering is the right behavior for the original implementation, I was quite pleased when I saw that the new implementation handled this edge case automatically and sensibly!
Consternation
Okay, this blog post ended up being heavy on explanation and light on code - so I apologize to all the code junkies out there.
Whew! If you've read this far, I commend you! I hope you learned something along the way or at least enjoyed the journey. My next post will focus on code - I promise.