Columns of a different color [Customizing the appearance of Silverlight charts with re-templating and MVVM]
When we created Silverlight Charting (background reading here and here), we tried to make things as designer-friendly as possible. So friendly, in fact, that it would be possible for someone to take the default look-and-feel of what we'd released and significantly enhance it without changing the Charting framework at all. :) That said, it's worth noting that Charting controls are a little different than typical WPF/Silverlight controls: while it might make sense to completely change how a ListBox looks, there are certain aspects of a chart that can't be changed without rendering the visualization meaningless. And so there are certain assumptions behind our Charting implementation around things we didn't expect users to want to change. But that's the great thing about users: they want to change these things anyway! :)
One of the fundamentals of column/bar charts is that the columns/bars of a single series are all drawn the same; that's what ties them together and makes it clear they represent a single series. If you create a column chart in Excel, the default color for the columns is blue. It's easy to change that color to orange or green or plaid, but by default all of the columns of the series change together because they're all part of the same series. (Incidentally, it is possible to change the colors of an individual column in Excel, but it's not entirely obvious how to do so and it's clearly not a mainline scenario.) With that in mind, it's no surprise that our charts behave similarly: you can provide whatever look you want for the columns and bars (via the ColumnSeries.DataPointStyle property, perhaps), but the columns and bars of a particular series always look the same.
But what if your scenario is such that you want to do things a little differently and you want more control over the colors of individual columns and bars? Well, you take advantage of re-templating and Model-View-ViewModel (MVVM), that's what! :) You're reading this blog, so I'll assume you already know what re-templating is - if not, here's a good place to start. Model-View-ViewModel (MVVM) is probably less well known to date - it's an approach to application development commonly used with WPF and Silverlight where simple wrapper classes are used to expose aspects of the underlying data types in a manner that's easy for the UI layer to deal with. You can read lots more about MVVM on John Gossman's blog or this recent MSDN article by Josh Smith. But I'm not here to teach you what re-templating or MVVM are - I'm here to show you how to use them with Charting to implement the multi-colored column scenario!
Imagine that you're a teacher and you want to chart the grades of your students. You've already got a basic Student class that exposes some basic properties and you can create instances from a database or a file or something. The Student class probably looks like this:
// Standard data object representing a Student
public class Student : INotifyPropertyChanged
{
    // Student's name
    public string Name { get; private set; }

    // Student's favorite color
    public Brush FavoriteColor { get; private set; }

    // Student's grade
    public double Grade
    {
        get { return _grade; }
        set
        {
            _grade = value;
            Helpers.InvokePropertyChanged(PropertyChanged, this, "Grade");
        }
    }
    private double _grade;

    // Student constructor
    public Student(string name, Brush favoriteColor)
    {
        Name = name;
        FavoriteColor = favoriteColor;
    }

    // INotifyPropertyChanged event
    public event PropertyChangedEventHandler PropertyChanged;
}
The class above exposes a name and a favorite color (which I've implemented here as a Brush for convenience). There's also a grade, but we'll come back to that shortly... The goal is for each column representing a student to be drawn using that student's favorite color. To accomplish this, all we need to do is re-template. Using a designer tool like Blend or something simple like my SilverlightDefaultStyleBrowser, we can copy the default Style for ColumnDataPoint and paste it into our project's resources. By removing stuff that's not relevant to the demonstration and making a single change (highlighted below), we arrive at something like the following:
<Style
    x:Key="ColorByPreferenceColumn"
    TargetType="charting:ColumnDataPoint">
    <Setter Property="Background" Value="DarkGray"/>
    <Setter Property="Template">
        <Setter.Value>
            <ControlTemplate
                TargetType="charting:ColumnDataPoint">
                <Border
                    BorderBrush="{TemplateBinding BorderBrush}"
                    BorderThickness="{TemplateBinding BorderThickness}">
                    <Grid Background="{Binding FavoriteColor}">
                        <Rectangle>
                            <Rectangle.Fill>
                                <LinearGradientBrush>
                                    <GradientStop Color="#77ffffff" Offset="0"/>
                                    <GradientStop Color="#00ffffff" Offset="1"/>
                                </LinearGradientBrush>
                            </Rectangle.Fill>
                        </Rectangle>
                        <Border BorderBrush="#ccffffff" BorderThickness="1">
                            <Border BorderBrush="#77ffffff" BorderThickness="1"/>
                        </Border>
                    </Grid>
                </Border>
            </ControlTemplate>
        </Setter.Value>
    </Setter>
</Style>
This is just a tweak of the default template so that each column pulls its Background Brush from the FavoriteColor property of the underlying data object. Hook that up to a Chart/ColumnSeries in XAML, and that's all there is to it:
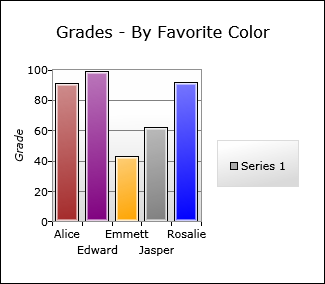
By the way, here's the XAML for that Chart:
<charting:Chart
    x:Name="FavoriteColorColumnChart"
    Title="Grades - By Favorite Color"
    Grid.Column="0">
    <charting:ColumnSeries
        DependentValueBinding="{Binding Grade}"
        IndependentValueBinding="{Binding Name}"
        DataPointStyle="{StaticResource ColorByPreferenceColumn}">
        <charting:ColumnSeries.DependentRangeAxis>
            <charting:LinearAxis
                Minimum="0"
                Maximum="100"
                Title="Grade"
                ShowGridLines="True"/>
        </charting:ColumnSeries.DependentRangeAxis>
    </charting:ColumnSeries>
</charting:Chart>
Aside: This process is even easier on WPF! (Assuming I had access to something like daily builds of Charting for WPF, I might have even mocked this up quickly to prove it to myself...) Unfortunately, the necessary "Binding in a Setter" capability is not supported by Silverlight 2 in XAML or code:<Style x:Key="ColorByPreferenceColumn" TargetType="charting:ColumnDataPoint"> <Setter Property="Background" Value="{Binding FavoriteColor}"/> </Style>
So that's how easy it is to get custom column and bar colors if your data objects already expose the information you need!
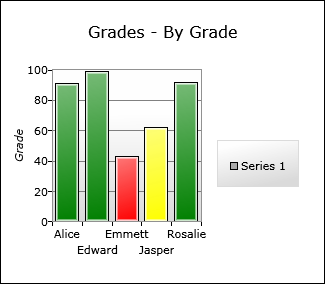
But what if you want to base the custom colors on something that's not directly available on the data objects and you also don't have the freedom to change the data objects themselves? In other words - continuing the example above - let's say we decided to change things so the columns are colored according to each student's current grade: great grades get green columns, satisfactory grades get yellow columns, and unsatisfactory grades get red columns.
The first thing to consider when faced with a problem like this is whether an IValueConverter will work. I've written about the usefulness of IValueConverter before, so I won't spend more time on that here. IValueConverter is great if you want to take a single property and mutate it as part of a Binding. But what if you want to do something more complicated than that? Well, on WPF there's IMultiValueConverter which might do the trick, but that's not available on Silverlight and it's not always the answer anyway. So let's take advantage of MVVM to wrap our existing Student data objects with an object that's more view-friendly: StudentViewModel. Here's a trivial StudentViewModel class that exposes a Student and a Brush that's colored according to the Student's Grade property. Because Student implements INotifyPropertyChanged (like a well behaved class should), StudentViewModel can listen for changes to the Grade property and update its Brush automatically. StudentViewModel also implements INotifyPropertyChanged - so that anything referencing it will be notified about changes to the GradeColor property it exposes. Here's how it looks in code:
// Custom data object to wrap a Student object for the view model
public class StudentViewModel : INotifyPropertyChanged
{
    // Student object
    public Student Student { get; private set; }

    // Color representing Student's Grade
    public Brush GradeColor { get; private set; }

    // StudentViewModel constructor
    public StudentViewModel(Student student)
    {
        Student = student;
        student.PropertyChanged += new PropertyChangedEventHandler(HandleStudentPropertyChanged);
    }

    // Detect changes to the Student's grade and update GradeColor
    void HandleStudentPropertyChanged(object sender, PropertyChangedEventArgs e)
    {
        if ("Grade" == e.PropertyName)
        {
            if (Student.Grade < 50)
            {
                GradeColor = new SolidColorBrush { Color = Colors.Red };
            }
            else if (Student.Grade < 80)
            {
                GradeColor = new SolidColorBrush { Color = Colors.Yellow };
            }
            else
            {
                GradeColor = new SolidColorBrush { Color = Colors.Green };
            }
            Helpers.InvokePropertyChanged(PropertyChanged, this, "GradeColor");
        }
    }

    // INotifyPropertyChanged event
    public event PropertyChangedEventHandler PropertyChanged;
}
Aside: I've typically seen view model classes implemented by re-exposing each of the interesting data object properties - so for each propertyFooon the data object, there will be a propertyFoo'on the view model object (which is either identical to the original property or some derivative of it). While I can see the value of this approach in some cases, the duplication of properties always bothers me and so I've instead exposed the entireStudentobject from theStudentViewModelobject as a property (along with the newGradeColorproperty). This saves me from duplicating any existing properties, exposes the entireStudentobject to users of theStudentViewModelobject, and is completely future-proof because any updates to theStudentimplementation will automatically show up for users ofStudentViewModel.
Now that we've got a view model class that exposes a view-friendly property that is exactly what we need, our job is easy: change the chart to use StudentViewModels and change the custom template to reference the GradeColor property. Here's the new template (with the same kind of change as before):
<Style
    x:Key="ColorByGradeColumn"
    TargetType="charting:ColumnDataPoint">
    <Setter Property="Background" Value="DarkGray"/>
    <Setter Property="Template">
        <Setter.Value>
            <ControlTemplate
                TargetType="charting:ColumnDataPoint">
                <Border
                    BorderBrush="{TemplateBinding BorderBrush}"
                    BorderThickness="{TemplateBinding BorderThickness}">
                    <Grid Background="{Binding GradeColor}">
                        <Rectangle>
                            <Rectangle.Fill>
                                <LinearGradientBrush>
                                    <GradientStop Color="#77ffffff" Offset="0"/>
                                    <GradientStop Color="#00ffffff" Offset="1"/>
                                </LinearGradientBrush>
                            </Rectangle.Fill>
                        </Rectangle>
                        <Border BorderBrush="#ccffffff" BorderThickness="1">
                            <Border BorderBrush="#77ffffff" BorderThickness="1"/>
                        </Border>
                    </Grid>
                </Border>
            </ControlTemplate>
        </Setter.Value>
    </Setter>
</Style>
The XAML for this chart is nearly identical and the end result looks just how we wanted it to:
Having shown off how re-templating and MVVM enable more advanced Charting customization scenarios, I've accomplished what I set out to do and could have stopped here... But there was still one customer scenario I wanted to address: synchronizing the colors of pie slices in a pie chart with the colors of columns in a column chart. Given what we've just discussed, the solution is easy: just repeat the re-templating process for a second chart with a PieSeries and PieDataPoints. Because the column/slice colors come from the data objects and because both charts are sharing the same data objects, the color for every data object (student) will naturally be the same across both charts. The re-templated XAML is the same as before and the final result is exactly what we want:
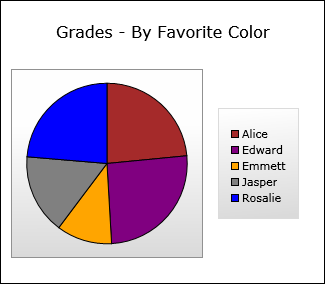
Well, actually, that's not entirely true; Getting the pie slices right was trivial - but there was a bit of additional effort required to synchronize the colors of the pie chart's legend items with the pie slices...
The way things work is that the Series creates whatever LegendItems it needs. As part of that creation, it also creates a "fake" DataPoint that's styled just like the "real" ones displayed in the chart. This fake data point exists so that the LegendItem's default Template can create Bindings for things like the Background and BorderBrush properties. (Recall that users can completely change the look of a DataPoint, so the only way we have to know how something will look is to create it and see.) This approach works out pretty well, but there was an oversight that caused problems for me when I tried to provide my own PieSeries.LegendItemStyle: the DataContext of the fake PieDataPoint wasn't set to the corresponding slice's data object. Normally, that's no big deal because it's unused - however in this case it's a problem because the custom Template we created above gets its color from the data object. Without a bound data object to provide context, the legend items weren't using the right colors. :(
I thought about a few ways to work around this, but eventually decided the fix (the setting of the DataContext property for the fake PieDataPoint) belonged in the Charting code itself. Fortunately, Charting is open source, so it's easy for anybody to make such changes if/when the need arises! I've included a copy of the relevant source file with the one-line change I made (Changes\PieSeries.cs, line 317) and changed the sample project to use a custom build of Charting's Microsoft.Windows.Controls.DataVisualization.dll assembly that includes this change.
And because I'm a nice guy, I also made the same change to the actual charting source code that's under development, got it reviewed, and submitted it (along with an associated unit test) for inclusion in the next official release of the Silverlight Toolkit! After all, if I needed this to work for my sample, chances are good that someone else might need it to work for their application as well. :)
With that fix in place, here is the Style that applies the proper color to the LegendItems:
<Style
    x:Key="ColorByPreferenceLegendItem"
    TargetType="charting:LegendItem">
    <Setter Property="Template">
        <Setter.Value>
            <ControlTemplate TargetType="charting:LegendItem">
                <StackPanel Orientation="Horizontal">
                    <Rectangle
                        Width="8" Height="8"
                        Fill="{Binding DataContext.FavoriteColor}"
                        Stroke="{Binding BorderBrush}"
                        StrokeThickness="1" Margin="0,0,3,0"/>
                    <datavis:Title Content="{TemplateBinding Content}"/>
                </StackPanel>
            </ControlTemplate>
        </Setter.Value>
    </Setter>
</Style>
And there you have it: a few simple ways to take Charting and extend it to do exactly what you want! The examples here are fairly simple, but re-templating and MVVM are very powerful concepts which enable a high degree of customization for Silverlight and WPF applications that's pretty hard to come by in other platforms. If you're trying to do something unique and you're not having any luck the "normal" way, please take a few moments to consider the techniques discussed here - you may find that your problem has an easy solution after all!