Where's your leak at? [Using WinDbg, SOS, and GCRoot to diagnose a .NET memory leak]
In my last post, I explained how it was possible for "hidden" event handlers to introduce memory leaks and showed an easy way to prevent such leaks. I used a sample application to contrast a leaky implementation with one that uses the WeakEventListener class (included as part of the post) to avoid leaking on Silverlight. The changes required to patch the leak were fairly minimal and the entire process was pretty straightforward. But I glossed over one important point...
What if you don't know the source of the memory leak in the first place? Knowing how something is leaking is the first step to fixing it, and the web has some great resources for learning more about tracking down managed memory leaks in WPF and Silverlight applications. I am not going to try to duplicate that information here. :) Instead, I'll refer interested readers to these excellent resources and recommend a bit of web searching if additional background is needed:
- "Tracking down managed memory leaks (how to find a GC leak)" by Rico Mariani
- "Finding Memory Leaks in WPF-based applications" by the WPF Performance team
As luck would have it, there are also a number of fine tools available to help find managed memory leaks. Being a rather frugal individual myself, I nearly always prefer to use free stuff and it just so happens that two of the best tools available are free from Microsoft! They are:
- WinDbg, a core part of the Debugging Tools for Windows and one of the best systems-level debuggers anywhere
- SOS, a WinDbg extension that comes with both WPF and the Silverlight developer runtime
Again, this post is not a tutorial for either tool. :) Instead, it will demonstrate how to use these tools together to answer a specific question: What part of the sample application's LeakyControl code is causing a leak? The basic technique I'll use is described in the following two posts which do a great job covering the topic:
- "SOS: finding the method bound to an EventHandler with WinDbg" by Mark Smith
- "Method Calls: Part 1 (Normal Call)" by Greg Young
Now that we're ready to go, let's remind ourselves what the demo application looked like:
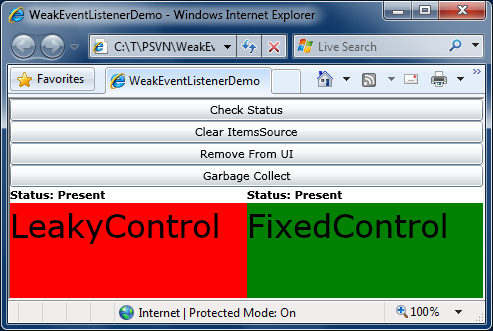
To reproduce the leak, build the sample application and run it outside the Visual Studio debugger (because we'll be using WinDbg instead). You can do this by hitting Ctrl+F5 ("Start Without Debugging") or by double-clicking the TestPage.html file in the Bin\Debug folder. As before, click "Remove From UI" to discard both controls, then click "Garbage Collect" to perform a collection, then click "Check Status". You'll see that FixedControl is gone, but LeakyControl is still present despite our attempt to get rid of it.
Now start WinDbg from the Start Menu, hit F6 to "Attach to a Process", and pick the iexplore.exe instance corresponding to the test application. (If there are multiple instances of iexplore.exe, you can determine the proper PID via Task Manager or you can just guess - it's nearly always the one at the bottom of the list!) If all went well, you'll see a bunch of modules get loaded and a couple of them should have "Silverlight" in their path. (If not, try again and attach to a different instance of iexplore.exe.) Great, now we're ready to go!
First, we'll load the SOS debugging extension:
0:012> .loadby sos coreclr
In this case, we know we're leaking an instance of the LeakyControl class, so what we'll do is find all of the instances of LeakyControl in the managed heap. We expect there to be zero at this point, so if one is present, then it has been leaked. DumpHeap tells us this easily:
0:012> !DumpHeap -type LeakyControl
 Address       MT     Size
03ff6df4 02f43c80       56
total 1 objects
Statistics:
      MT    Count    TotalSize Class Name
02f43c80        1           56 WeakEventListenerDemo.LeakyControl
Total 1 objects
Yep, we're leaking an instance of LeakyControl... Let's find out what reference is keeping this instance alive:
0:012> !GCRoot 03ff6df4
Note: Roots found on stacks may be false positives. Run "!help gcroot" for
more info.
Scan Thread 10 OSTHread 7ec
Scan Thread 11 OSTHread e44
Scan Thread 12 OSTHread e04
DOMAIN(003CB450):HANDLE(Pinned):2f512f8:Root:  04fe78e0(System.Object[])->
  03fef5bc(WeakEventListenerDemo.App)->
  03ff0710(WeakEventListenerDemo.Page)->
  03ff77b0(System.Collections.ObjectModel.ObservableCollection`1[[System.Int32, mscorlib]])->
  03ff7a20(System.Collections.Specialized.NotifyCollectionChangedEventHandler)->
  03ff7a08(System.Object[])->
  03ff7920(System.Collections.Specialized.NotifyCollectionChangedEventHandler)->
  03ff6df4(WeakEventListenerDemo.LeakyControl)->
I find it's usually easiest to start from the bottom of GCRoot output: in this case we see the LeakyControl instance is referenced by an instance of NotifyCollectionChangedEventHandler. Now, in the trivial sample application that's all we need to identify the source of the leak and we could stop here. But in a larger, more realistic application there might be many places where a NotifyCollectionChangedEventHandler is created - let's see if we can narrow this down even further:
0:012> !DumpObj 03ff7920
Name:        System.Collections.Specialized.NotifyCollectionChangedEventHandler
MethodTable: 02e9dcc0
EEClass:     02ea0760
Size:        32(0x20) bytes
File:        c:\Program Files\Microsoft Silverlight\2.0.40115.0\System.Windows.dll
Fields:
      MT    Field   Offset                 Type VT     Attr    Value Name
02a444e8  40001e0        4        System.Object  0 instance 03ff6df4 _target
02c13c58  40001e1        8 ...ection.MethodBase  0 instance 00000000 _methodBase
02b00a90  40001e2        c        System.IntPtr  1 instance  2f4c14c _methodPtr
02b00a90  40001e3       10        System.IntPtr  1 instance        0 _methodPtrAux
02a444e8  40001e4       14        System.Object  0 instance 00000000 _invocationList
02b00a90  40001e5       18        System.IntPtr  1 instance        0 _invocationCount
What would be nice is if we could figure out which method in LeakyControl corresponds to that _methodPtr because doing so would tell us which particular event hook-up was involved. Let's try the easy way first:
0:012> !IP2MD 2f4c14c
Failed to request MethodData, not in JIT code range
Okay, so much for the easy way; the method hasn't been JITted yet. Let's look at the code corresponding to _methodPtr next:
0:012> !U 2f4c14c
Unmanaged code
02f4c14c b84c3cf402      mov     eax,2F43C4Ch
02f4c151 89ed            mov     ebp,ebp
02f4c153 e9bc46ceff      jmp     02c30814
02f4c158 00b000eb18b0    add     byte ptr [eax-4FE71500h],dh
02f4c15e 02eb            add     ch,bl
02f4c160 14b0            adc     al,0B0h
02f4c162 04eb            add     al,0EBh
02f4c164 10b006eb0cb0    adc     byte ptr [eax-4FF314FAh],dh
02f4c16a 08eb            or      bl,ch
02f4c16c 08b00aeb04b0    or      byte ptr [eax-4FFB14F6h],dh
Because the method hasn't been JITted, it's a pretty safe bet that we're looking at a thunk here. Let's take the value it's using and try to examine that as a MethodDesc:
0:012> !DumpMD 2F43C4C
Method Name: WeakEventListenerDemo.LeakyControl.OnCollectionChanged(System.Object, System.Collections.Specialized.NotifyCollectionChangedEventArgs)
Class:       02f41b18
MethodTable: 02f43c80
mdToken:     06000013
Module:      02f433bc
IsJitted:    no
CodeAddr:    ffffffff
Success! We see this event handler is for the LeakyControl.OnCollectionChanged method - so now we know exactly which event handler hook-up is responsible for the leak. And, armed with the knowledge from my last post, we've got everything we need to fix this code and patch the leak!
Once we do, our code will be a little better behaved, our developers won't have to track down leaks in our code, and our users will see more solid, more predictable behavior with lower memory use. Nice work - it's donut time! :)