Peanut butter jelly time [How to: Create a pleasing visual effect with Silverlight/WPF Charting]
I was recently part of an e-mail thread with Pete Brown discussing the prospects of reproducing Richard Zadorozny's cool "jelly chart" behavior with the official Silverlight/WPF Charting controls from the Silverlight Toolkit. Richard's sample is really fun to play around with - but at the core it's really just a slick user experience demo masquerading as a charting solution. The question was: how hard it would be to take a real-world charting solution and get it to masquerade as a slick user experience demo...
I had some particular opinions on how to go about this, and said I'd put together a quick sample to show off my approach. I was aware of this sample when we started work on Silverlight/WPF Charting and made sure that Charting supported two specific things to make this kind of behavior easy: the DataPointSeries.AnimationSequence property and the Reveal/Show VSM state. In fact, I wrote a similar sample that's been part of the public charting samples since our first release. To find it, load the samples, pick the "Column Series" page from the left-hand column, then switch to the "Animation" tab at the top. The "Custom: Grow" samples show off the basic concept - all that's missing is the easing and that's easy (no pun intended) to add via Silverlight 3's built-in support.
However, as I thought about duplicating the jelly scenario for a few moments, I realized line series would be more challenging - because the line's shape tracks the actual data values and isn't covered by a VSM animation the way its points are. Fortunately, I had another trick up my sleeve - and thus the following Silverlight 3 sample was born:
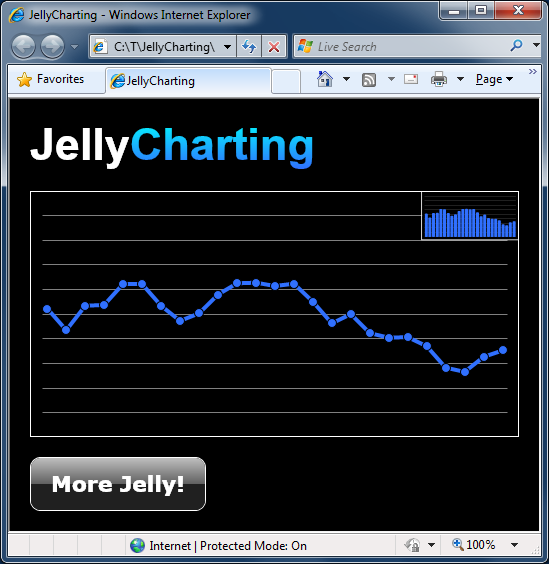
Click here or on the image above to run the sample in your browser.
Click here to download the complete source code for the sample.
While I didn't go out of my way to duplicate every aspect of the original demo, I did try to pay homage to it.
My solution is a straightforward IValueConverter implementation (more background) that can be easily dropped into an existing chart to add the cool jelly behavior. For simplicity, my implementation assumes the original data is Points and uses fixed values for delays and stuff - but that's just to keep things easy to read and understand. It would be quite easy to modify or extend what I've done to flexibly support more general scenarios.
Here's the relevant code:
// IValueConverter implementation that creates a "jelly" effect for showing chart data
public class JellyConverter : IValueConverter
{
    // Converts an ICollection of Points to an ICollection of animated JellyPoints
    public object Convert(object value, Type targetType, object parameter, CultureInfo culture)
    {
        // Type-check input
        var originalPoints = value as ICollection<Point>;
        if (null == originalPoints)
        {
            throw new NotImplementedException("JellyConverter only supports value type ICollection<T>.");
        }

        // Fixed paramaters (could be set via properties or parameter)
        var duration = TimeSpan.FromSeconds(0.5);
        var delay = TimeSpan.FromSeconds(0.5);
        var ease = new ElasticEase { Oscillations = 1 };

        // Prepare Storyboard
        var count = originalPoints.Count;
        var jellyPoints = new List<JellyPoint>(count);
        var storyboard = new Storyboard();
        var propertyPath = new PropertyPath("Y");
        var i = 0;

        // For each Point...
        foreach (var originalItem in originalPoints)
        {
            // Add a corresponding JellyPoint
            var jellyPoint = new JellyPoint { X = originalItem.X, Y = 0 };
            jellyPoints.Add(jellyPoint);

            // Create an animation
            var animation = new DoubleAnimationUsingKeyFrames();
            Storyboard.SetTarget(animation, jellyPoint);
            Storyboard.SetTargetProperty(animation, propertyPath);

            // Configure the initial delay and "jelly" behavior
            var thisDelay = TimeSpan.FromSeconds(delay.TotalSeconds * ((i + 1.0) / count));
            animation.KeyFrames.Add(new LinearDoubleKeyFrame
            {
                KeyTime = thisDelay,
                Value = 0
            });
            animation.KeyFrames.Add(new EasingDoubleKeyFrame
            {
                KeyTime = thisDelay + duration,
                Value = originalItem.Y,
                EasingFunction = ease
            });

            // Add animation to Storyboard
            animation.Duration = thisDelay + duration;
            storyboard.Children.Add(animation);
            i++;
        }

        // Play the Storyboard
        storyboard.Begin();

        return jellyPoints;
    }

    // Custom Point-like class allows easy animation of Y property
    public class JellyPoint : DependencyObject, INotifyPropertyChanged
    {
        // Static X value
        public double X { get; set; }

        // Dynamic Y value
        public static readonly DependencyProperty YProperty = DependencyProperty.Register(
            "Y", typeof(double), typeof(JellyPoint), new PropertyMetadata(YPropertyChanged));
        public double Y
        {
            get { return (double)GetValue(YProperty); }
            set { SetValue(YProperty, value); }
        }
        private static void YPropertyChanged(DependencyObject o, DependencyPropertyChangedEventArgs e)
        {
            var jellyPoint = (JellyPoint)o;
            var handler = jellyPoint.PropertyChanged;
            if (null != handler)
            {
                handler.Invoke(jellyPoint, _yPropertyChangedEventArgs);
            }
        }
        private static PropertyChangedEventArgs _yPropertyChangedEventArgs =
            new PropertyChangedEventArgs("Y");

        // INotifyPropertyChanged event
        public event PropertyChangedEventHandler PropertyChanged;
    }

    // Unimplemented/unnecessary method
    public object ConvertBack(object value, Type targetType, object parameter, CultureInfo culture)
    {
        throw new NotImplementedException();
    }
}
Notes:
- The
IValueConverterworks by looking at the inputPointcollection and replacing it with a corresponding collection ofJellyPointobjects. TheseJellyPointobjects are special in that theirYproperty is a DependencyProperty and can therefore be animated by a Storyboard. Furthermore, they implement the INotifyPropertyChanged interface, so Charting automatically registers to get notifications every time the value changes. That done, aStoryboardis created to animate each of theYvalues of theJellyPointsfrom zero to their target values in left-to-right sequence. An easing function is applied to each animation to give the desired "jelly" effect. And Charting's built-in support for dynamic data automatically does all the rest of the work! - Note that
DataPointSeries.TransitionDurationis set to 0 so Charting knows not to try to animate each value change itself - that's what the custom Storyboard is doing, after all! - You can click the little thumbnail in the upper right of the chart to switch from line to column. The switch is done smoothly with a standard
Storyboard- though I do register a Completed event handler so I can bring the new thumbnail to the top after the animation is done. (Recall that when two elements overlap, one of them is always on top - and that role swaps every time the thumbnail is clicked.) - I mentioned above that the
IValueConvertershouldn't be necessary for the column sample because Charting natively supports everything that's needed - but I used theIValueConverteranyway... What gives? Well, this is one of those things where it's harder to do a sample than it would be to do the real thing... When I run the sample, I always end up clicking the "More jelly!" button like a hyperactive monkey - and Charting wasn't designed for that kind of behavior. Specifically, when theAnimationSequenceproperty is set, the corresponding in- and out-animations are always run to completion. They each have a duration of one second, so when someone goes nuts clicking, the animations start falling behind and the visuals start to lag. Things eventually settle correctly, but I'm not very patient and I used theIValueConverterjust in case there are any other click-happy folks out there.
I've always thought the original "jelly charts" sample was really well done - it was fun to reproduce it using a "real" charting package.